BSI_Slide_4 - original.png

July 2017
By Ronald P. Bernardi

As of this writing, the State of Illinois began its fiscal year (July 1) without a budget for an unprecedented third year in a row. Sunday evening the Illinois House of Representatives approved a $36 billion spending plan that increases personal income taxes to 4.95% from the current 3.75% level and the corporate levy to 7% from 5.25%. If the Senate, which approved a tax hike last month, concurs on the House bill it will be presented to the governor for consideration. He has stated he will veto both the House and Senate spending bills as currently written.

Unfortunately, the Democrat controlled state legislature and Republican minority and governor have been unable to reach a compromise agreement. The opposing groups have failed to reach an agreement on how to balance revenues with expenditures, reduce growing pension costs and pay down the state’s backlog of overdue bills. As a result, the state’s credit rating is in jeopardy of falling into the “junk” status category. Such an event will likely further raise borrowing costs for most entities across the state.

Given these problems and the heightened uncertainty they create, we want to share some thoughts with you.

Clearly, the state’s financial situation is perilous and requires immediate remedy. The state is not yet Puerto Rico’s dystopian twin, but it is travelling in a dangerous direction. It remains uncertain to us whether opposing parties can come to some sort of agreement. Therefore, we remain wary of credits directly related to the state’s finances. As we have done for years, our portfolio managed accounts continue to avoid issues in this group.

Additionally, we remain wary of any sub-state credits OVERLY RELIANT on the state as a funding source. These municipalities are vulnerable to the vagaries and uncertainty of the state’s financial condition.

But NOT ALL  issuers located in Illinois fall into the “overly reliant” category. Admittedly, it is a partially subjective determination defining “overly reliant” and we rely heavily on the analysis of our in-house municipal credit team to make these determinations. From these determinations we make certain investment decisions.

Making these determinations is the “art of municipal credit analysis” and an important reason our clients hire us to manage their bond portfolios.

We have heard and read some municipal market commentators state very broadly that municipalities in the State of Illinois are in trouble and that investors should avoid them or sell out of existing  positions. These views are meaningless to us if there is no attendant detailed analysis of the specific issuer’s financial credit and its relationship with the state.

It seems to us there is a fair bit of “throwing the baby out with the bath water” occurring these days. And this creates opportunities, in our view.

So we suggest taking a deep breath.  Please call us with your questions and justified concerns.

We will review the issuer’s credit standing, looking carefully at numerous credit metrics including:

  • the sources of funding for the bonds
  • the legal standing of the debt (UTGO, LTGO, COP, NOTE  etc.)
  • the purpose of the issuance
  • its dependency on state funding
  • its balance sheet and state of its general fund

After careful consideration of the Three Pillars of Credit Analysis, we can make an educated assessment as to an appropriate action.

Undoubtedly, the continued inaction at the state level hurts investment and opportunities for businesses, residents and municipal governments across the state. Population and income growth in Illinois is stagnant and slightly negative when compared to most other parts of the country. Reducing taxpayers’ total liability (some measure at $300 billion) requires higher than average growth, so the stagnant economy since 2007 is clearly a negative metric. We expect the flat-lining or slow bleed of population will likely continue absent a political agreement to the state’s financial distress. But we do not conflate these negatives (and they are considerable) with widespread municipal defaults in Illinois.

Our approved list of Illinois-based credits and Illinois sector weighting has declined over the last 5-6 years while our surveillance efforts have greatly increased.

Yet the number of  solid credits remains ample. Importantly, these issuers are forced to pay higher interest rates. The “Illinois Effect” offers value to knowledgeable investors and it is these values we seek.

Our in-house municipal credit department is one of our keys to uncovering these value opportunities. If you have questions or concerns about the credit quality of specific municipalities, please contact us and we can discuss completing a credit review.

If you are interested in learning about our municipal bond portfolio management platform we offer two options:

– fiduciary, fee only through our SEC registered investment advisory subsidiary, Bernardi Asset Management (BAM)
– non-fee, mark-up basis through parent company, Bernardi Securities, Inc. (BSI)

Please contact your Bernardi Investment Specialist for more information.

Thank you for your continued confidence and a happy Fourth of July holiday to all.

Sincerely,

Ronald P. Bernardi

President and CEO

July 3, 2017

2017 Cost of Waiting Cartoon FP.png

May 2017
By Matthew P. Bernardi

Web cartoon
The post-crisis monetary policy reaction pushed interest rate markets into unchartered waters of zero interest rate policy (ZIRP). We have all become somewhat deadened to this reality over the last handful of years as monetary policy has led to heightened market valuations, paired with one of the longest periods of economic expansion (93 months) in our economic history.

The S&P 500 Index trades at a Shiller PE Ratio of 29.34. This is a level only surpassed by the levels in 1987 – prior to Black Tuesday – and the dot-com bubble. U.S. Treasury bond yields remain near historical lows, with real yields (nominal yield less the inflation rate) barely above zero at the intermediate portion of the curve. Many investors have missed the dual rally and remain under invested in hopes of a great unwind.

And so the critical question at hand for us and many bond investors remains: how does one sensibly invest in today’s bond market? We recognize the seemingly endless state of the present day market’s paradigm (high valuations) and the conundrum it engenders for municipal bond investors.

But we disagree with those that assert the answer to the question at hand is “sitting on” large cash balances in order to “time” the bond market.

We have written on this topic frequently and extensively over the years. See 2014’s The Problem with Waiting for the “Fed” to Raise Rates or 2010’s “The Cost of Waiting”. Our theme on this topic has been unwaveringly consistent: the cost of waiting (i.e. market timing) comes with a large opportunity cost and is a difficult task.

Depicted below is the growth of a portfolio adhering to our Intermediate Strategy compared to our Short Strategy over the last five years.

ZIRP Dilemma chart

A difference of less than one percent annualized rate of return between the two strategies, yields a dollar difference of almost $150,000 on a $3,000,000 portfolio. This example demonstrates both the power of compounding and the danger in waiting for the ”right hand” in today’s market.

We firmly believe in strategically playing the hand you are dealt. Today’s economy is weighed down with several weak economic fundamentals – high levels of debt, low productivity growth rates, and a tightening Fed in an economy that remains sluggish. These economic indicators, historically, portend stable – if not lower – long term yields, begging the question “is now the time to go all in on bonds with your hand of cards?“

That question posed, there a number of indicators that hint at higher levels of future economic growth. The unemployment rate is near a decade low 4.67%, there are bright spots within demographics and population growth (women in their 30s are giving birth at the highest rate since the 1960s), and paradigm shifting innovations are gaining hold (e.g. driverless cars, immunotherapy to help cure cancer, or even the billionaire-catalyzed space-race). These items suggest higher growth/productivity in the future, i.e. higher rates, and your portfolio should remain conservative from a duration standpoint.

How does this all impact our approach?

First – we do not attempt to guess whether going all in or waiting for a better hand will be the best bet. Frankly that is impossible to predict from market cycle to market cycle, in our view. This strategy comes to fruition through our laddered approach to maturity selection, where market timing is secondary to bottom up credit analysis and individual security selection. This approach is especially relevant and valuable in the nuanced and arcane municipal bond market where expertise and specialization often uncovers value (i.e. higher yields on solid credits).

Secondly, but not any less important, we invest your portfolio as a separate account, giving you control of the underlying assets with predetermined maturity lengths. Call it your own, solely-owned mutual fund, without the interference of outside investors directly bidding up or down your asset and the transparency of knowing what you own and when it cash flows.

That is our traditional approach to the market, and the investors that have stuck with it through times of crisis and expansion, have benefited mightily. This time is very different but your approach should remain the same.

Fishing3.png

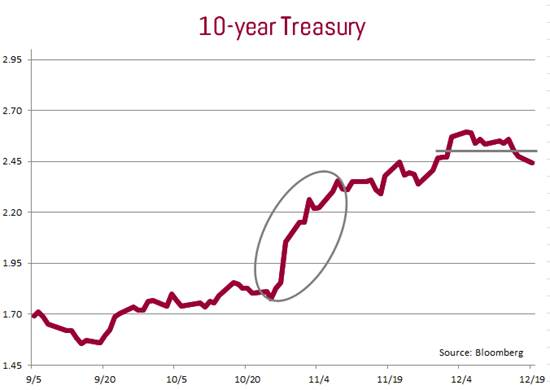
Following Janet Yellen’s recent testimony, many investors may just want to wait for Federal Reserve policy makers to raise interest rates before committing money to the bond market. After all, the fed funds rate has been held in the 0% to 0.25% range for years so rates must go up, right? The answer is perhaps, but interest rate timers may have wasted four years waiting to catch a bigger fish – and just missed it. Most of the hike in interest rates that investors have been waiting for may have already happened.

In just the past 15 months, the yield on the benchmark, 10-year Treasury note has climbed from 1.65% to 2.71% where it stands as of this writing. That’s a 106 basis point increase in yield at the same time the fed funds rate has remained unchanged.

Analysis of past four Fed tightening cycles

Shown below is an analysis of the past four Fed credit tightening cycles along with the resultant yield for the 10-year Treasury note during the same period. You will notice that the fed funds rate actually ended up higher than the yield on the Treasury in three of the four cycles.

July 1, 2004 thru September 2007

  • Fed funds rate increased from 1.00% to 5.25% – plus 425 basis points
  • 10-year Treasury note yield decreased from 4.56% to 4.52% – lower by 4 basis points

June 30, 1999 thru May 16, 2000

  • Fed funds rate increased from 4.75% to 6.50% – plus 175 basis points
  • 10-year Treasury note yield increased from 5.78% to 6.42% – plus 64 basis points

February 4, 1994 thru February 1, 1995

  • Fed funds rate increased from 3% to 6% – plus 300 basis points
  • 10-year Treasury note yield increased from 5.87% to 7.65% – plus 178 basis points

January 1988 thru February 1989*

  • Fed funds rate increased from 6.50% to 9.75% – plus 325 basis points
  • 10-year Treasury note yield increased from 8.79% to 8.98% – plus 19 basis points

*Fed funds rate figures for this period are approximated as Federal Reserve decisions were not officially announced at the time.

*Fed Funds rate figures for this period are approximated as Federal Reserve decisions were not officially announced at the time.

It is important to remember that the Fed – aside from the quantitative easing policies, which are now being tapered – is not usually buying or selling longer dated bonds. Traders, investors and other market participants will generally dictate the yields on long bonds. Pricing is based in large part on future inflation and growth expectations. As the economy has shown signs of recovery, these participants have been driving the yields of long bonds upward to compensate for the expected erosion of net return that is caused by inflation.

When the Fed does start to raise the fed funds rate, a perverse thing, as far as those on the sidelines are concerned, usually happens as evidenced by the preceding analysis – the rates on long-term bonds peak and then start to fall. This happens because the prime rate is tied to the fed funds rate, which is directly tied to almost all forms of consumer and most business borrowing. When these rates go up the cost of borrowing goes up, which slows the economy. A slowing economy is usually welcome news for bond investors because costs of goods and services tend to stabilize or even fall, which preserves the buying power of fixed income investments.

The rising-rate advantage of individual bonds

The reason many typical, buy and hold, municipal bond investors may not be buying longer-term bonds right now is because they have been scared into thinking that the value of their investment will decline sharply if interest rates rise. It is the dreaded total return argument.

For those buying individual bonds, perhaps the most important thing to consider is that you know the score of the game at the outset. Unlike bond fund investors ¬– whose investment lacks a maturity date and therefore will lose principal if rates rise – the individual bond buyer will receive their money back at maturity. From the first inning, the investor buying individual bonds knows the final score: the yield and the maturity. Fund investors lack that certainty – their return will fluctuate.

Calculating the cost of waiting

Here is an illustration to bring this all home. Assume one has $100,000 available to invest. Let’s say you can put the money in a long-term bond with a 4.00% coupon, priced at par or park it in a one-year bond yielding 0.50%. After a year, the investor in the ultra-short bond has received $500 while the long-term buyer earned $4,000. The short-term investor retains their options but at a steep cost.

Let’s say the ultra-short investor guessed correctly, though, and after one-year he or she is able to invest in a bond yielding 5.00%. The 5.00% bond generates $1,000 more interest annually than the 4.00% bond but it will take about four years for the short-term investor just to break even with the investor who put his money into the 4.00% bond today.

If the investor is right about the direction of rates but wrong about the size of the move – for instance, one is only able to invest at 4.75% – it will take about five years for him to catch up. If rates remain where they are, or decline, the investor will never catch up.

We are not advocating abandoning your current investment parameters to buy 30-year bonds. Rather, stick to your existing ladder and forget about trying to time the market. There’s a hefty price to pay for thinking you can predict the unpredictable.

As always, please contact us if you have any questions, or would like us to review your portfolio with you.

2017 Spring Quarterly FP.png
The post-election bond market volatility that occurred during the fourth quarter of 2016 continued into the first quarter of 2017. The 10-year AAA MMD index reached a low of 2.14% on January 18th and topped out at 2.49% on March 14th. The difference between the high and low yield for the quarter looks large, however; in absolute terms the yield change over the quarter was muted as the index ended the quarter yielding 2.23%, after starting the quarter at 2.31%.
Vexing Bond Market Questions FP.jpg

February 2017
By Ronald P. Bernardi
10 year Treasury and S&P 500

This chart demonstrates the volatility of the 10 year U. S. treasury bond since the beginning of 2016.

This volatility causes anxiety for many and understandably leads to several questions:

  1. Will long term bond yields increase as the Federal Reserve Bank increases its overnight lending bank rate?
  2. Should one invest in bonds now or wait until rates rise further?
  3. What is a proper equity/bond asset allocation given this volatility?

These are pertinent questions and are often posed to our Investment Specialists and Portfolio Managers during the course of a week.

The matter at hand of this writing is to share our thoughts with you regarding such inquiries.

We start by describing the role we serve.

  1. We are bond specialists and focus our efforts and skills accordingly in order to help our clients and their counsellors.
  2. We manage the “mattress money” portion of our clients’ fixed income investment portfolios.
  3. Safety of principal is our primary concern; we rely heavily on our in-house municipal bond credit team to assess issuer credit quality and liquidity.
  4. Net after–tax income generation is a very important goal;  we are less concerned with short term unrealized paper gains or losses.
  5. We believe an actively managed, value oriented, tactical ladder outperforms comparable market averages and helps to accomplish #3 and #4.

We have learned over several decades of experience that it is impossible to REGULARLY predict the movement of Federal Reserve Bank controlled interest rates and the larger bond market reaction to such Fed moves.

We, like others, have our opinions, but we understand there is a significant difference between opinion and fact. There are no facts regarding future events, only opinions, and we believe it is a fool’s errand to attempt to predict these events consistently over long periods of time.

The persistent state of low rates over the last five or six years proves the point. How many pundits, how many times predicted higher bond yields over the last five to six years?

We believe you must play the hand you are dealt, instead of frequently folding to wait for a better day. Our “tactical ladder” bond portfolio strategy is a measured strategy and a conservative approach to today’s low growth/low rate environment.

Our approach avoids taking bold actions based on forecasts of uncertain future events (opinions). We believe this approach is imprudent for clients’ “mattress money” capital.

Instead, we focus, on uncovering value for client portfolios based on our municipal credit analysis (facts) and our market expertise about bond pricing (facts). We are keenly aware of what we DON’T know and our strategy, therefore, is focused on what we understand. Our litmus test for determining the success of a portfolio strategy is if it produces the desired results.

Here is how we define portfolio success:

  • Solid credit quality
  • Steady income stream
  • Low portfolio volatility
  • Minimal client anxiety

Early in my career attempting to provide a satisfactory answer to the third question above (asset allocation) was a vexing issue for me.

That changed many years ago. I will share some advice I received directly from Jack Bogle, the founder and retired CEO of The Vanguard Group.

Many years ago I dined with Jack when he was visiting Chicago. There were just four of us and we spent several hours together talking about his career, the Vanguard Group, Bernardi Securities, the financial markets and industry. It was one of the most fascinating and insightful business meetings of my career. I remember many of the things we discussed that evening including Jack’s answer to my inquiry about an appropriate stock versus bond portfolio mix.

He started his answer with many of the usual caveats including a proper allocation depends on the individual’s personality, tolerance for risk and volatility.

When I pressed him for a firm percentage he offered this allocation formula: divide your age into 100 to determine the conservative (bond) allocation. As an example, if one is 60 years old, then according to this formula an appropriate bond allocation is 60%. The remaining percentage needed to equal 100%, 40% in this example, represents the appropriate growth (equity) allocation. He acknowledged it as a simple approach. He told us the formula had worked well for him and others over the decades. Most importantly he stressed, it helps ensure that as an investor ages the portfolio becomes more conservative. He ended the topic by saying that whatever formula is applied, stick to it.

Simple and sage advice, in our view. Certainly, not appropriate for all, but definitely worth considering in these turbulent times.

We hope this writing is helpful and thought provoking. Please call us if you care to discuss and we thank you for your continued confidence.

Sincerely,

Ronald P. Bernardi
President and CEO
Bernardi Securities, Inc.
February 15, 2017

2017 Winter Quarterly FPv2.jpg

The election of Donald Trump surprised many and sent bond markets into a market frenzy. On the day before the election, the 10-year AAA rated average municipal yield was 1.73%. By the end of November, the yield jumped to 2.51%. This 78 basis points jump in yield was more than the jump in the 10-year Treasury (+53 basis points) over the same timeframe.

Download PDF

2017 Rooster logo.png

By Jeffrey D. Irish

We wish you a healthy, happy and prosperous 2017. 

We thank our many clients and friends for your continued confidence and belief in the Bernardi team, our processes and the way we approach investing in today’s volatile bond market.

The Chinese zodiac designates 2017 as the  “Year of the Rooster”.  The rooster is the tenth in the twelve year Chinese zodiac cycle. Dawn and awakening, of course, are associated with our barnyard friend.  The Chinese assign it confidence and dependability characteristics.  The phrase, “rise and shine” is  commonly associated with this year’s mascot.

And what an apt phrase and bond market metaphor the rooster portrays as we begin 2017! The market has awakened from its stupor of the last several years creating enhanced income earning opportunities for income-oriented bond investors. “Rise and shine”, indeed.

_______________________

The 10 year taxable U.S. treasury bond began 2016 yielding around 2.30% and ended the year paying 2.45%.

The intervening period was generally more tumultuous for most bond investors than what the beginning and ending yield metrics otherwise suggest.  Bonds offered investors a roller coaster ride last year creating some anxious moments with some of us wondering if the progeny of the 1980’s bond vigilantes had finally arrived. Last year many bond investors learned (re-learned) what Plutarch, the great, Greek philosopher, opined on more than 2400 years ago: “ it is circumstance and proper timing that give an action its character and make it either good or bad.”

Shown below is a 3-month graph of the 10-year, Treasury Note yield. As you can see, the yield spiked immediately after the election as traders and investors adjusted to what a “Trump Presidency” might do to growth and inflation expectations. Recent movement shows a flattening trend-line, albeit at significantly higher yield levels once the initial yield increases occurred. We anticipate this trend-line will hold near current levels in the short term until the market sees some real evidence of economic growth as 2017 unfolds.

10-year Treasury yield

Municipal bond yields reacted in similar fashion and also made some adjustment to factor in the likelihood of lower income tax rates. Looking ahead, new issue supply in 2017 is expected to be healthy following a very robust new issue supply in 2016.  It is important to remember that refunding issues, which made up roughly 40%1 of the market in the past few years, may not be as plentiful in a higher interest rate environment. Supply and demand factors affect municipal yields to a greater extent than they affect Treasury bond yields.

Two months ago 20-year, “AA” rated municipal bonds were yielding around 2.70%. Today you can earn a yield to maturity of  3.30%2 on good quality, longer dated  issues.  This equates to approximately 4.50% for a taxpayer in a 28% federal income tax bracket and a more than 5.00% taxable equivalent for a 35% bracketed taxpayer.  Recently, we have seen yields approach, or equal, 4.00% on some issues that are on our approved list of credits.

If you have been sitting on cash waiting for higher yields, it may be time to allocate a portion to the market. If economic growth and projections do not materialize as quickly as some expect, rates could easily backtrack.

Please contact your Bernardi Securities Investment Specialist to discuss our tactical bond ladder strategy to potentially capitalize on these higher yields as we begin the “ Year of the Rooster”.

Again, thank you for your continued confidence.

Happy New Year!

Sincerely,

Jeff Irish
January 3, 2017

(1) Bond Buyer
(2) Source: Thomson-Reuters Municipal Market Data (MMD) Tables

By Matthew P. Bernardi

Municipalities have done an excellent job since the financial crisis in stabilizing their finances and have pulled a number of levers to reduce fixed costs. Today’s low growth environment calls for prudent management and the average municipality has taken a conservative approach, especially relative to corporations. That being said, this low growth world has exacerbated a larger – though longer term – issue in unfunded pension liabilities. Investment returns have underperformed actuarial assumptions for years and prospective returns look even dimmer. This is an issue cities and states must face, but we think a universal armageddon scenario often highlighted in the press is overplayed. In fact, in many places there is much more flexibility for adjusting and adapting to these liabilities than most investors think. Many municipalities have begun the process of reducing these obligations.

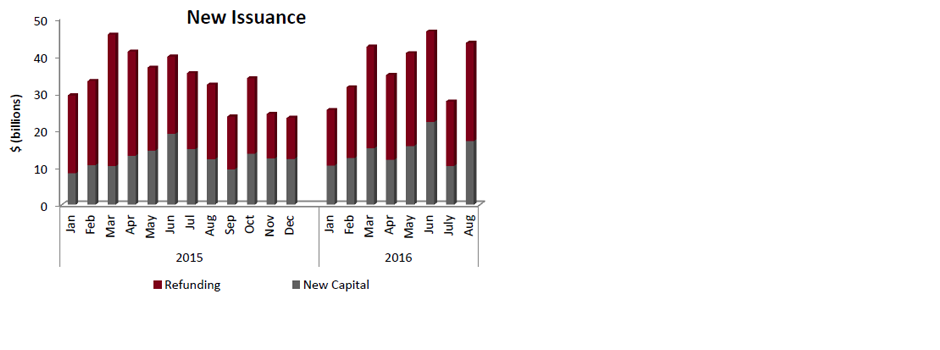
The total dollar value of the municipal market has barely grown since the 2008-2009 crisis. Outstanding debt totaled $3.77 trillion at the end of 2015, up from $3.54 trillion in 2006 (1). Corporate issuers have much more aggressively taken advantage of low rates. In fact, they have added an amount of debt almost equal to the size of the municipal market. Outstanding corporate debt has grown from $4.84 trillion in 2006 to $8.1 trillion at the end of 2015. It remains to be seen if this increased corporate leverage will lead to investment and future growth. Many point out the financing is primarily being redirected to buyback or even dividend payments.

Over time the municipal market has experienced a high level of refunding issues as a percentage of the overall issuance. This reduces the cost of debt for issuers and enhances cash flows. Limiting employment growth is another lever local municipalities have pulled to reduce costs. Total local government employment is 14.3 million today versus 14.5 million at the start of 2008 (2).

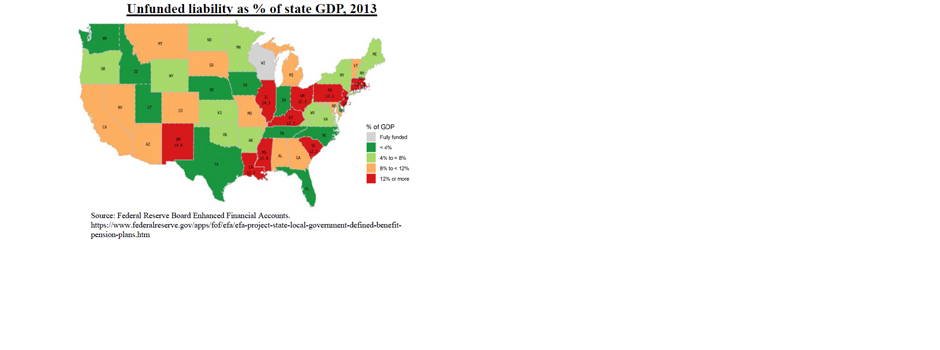
These dynamics are undeniably good news for the underlying credit health of municipal issuers. They are a prudent reaction in a paltry growth environment. Long term, however, municipalities face mounting pressure from defined benefit pension liabilities. At the end of June 2015 Wilshire Consulting reported that U.S. city and county pensions had 70 percent of the assets needed to meet their obligations to retirees.

A greater percentage of expenditures will go to service these liabilities, unless yields and investment returns pick up from today’s levels. That being said, for starters, we are talking about 30-year liabilities. Time is a friend at this point. Certainly, one could argue today’s political polarization (i.e. paralyzation) makes progress less likely. Look at the gridlock in Illinois, for example.

Many states and cities are already taking action to reduce their long term liabilities. Additionally, there have been a number of judicial rulings supporting such actions. This progress is good to see. Not only are governments working for taxpayers (and bondholders), but it proves there are potential remedies for solving pension underfunding.

Examples of pension overhauling:

  • Oklahoma passed the Retirement Freedom Act, which closed that state’s defined benefit system and replaces it with a defined contribution model.
  • Houston, TX Mayor says the 30-year fixed plan will pay off the estimated $7.7 billion the city owes its pension fund over the next three decades, cut yearly costs and require full yearly contributions to police, fire and municipal employee pensions.
  • Arizona voters approve pension overhaul measure Prop. 124. Prop. 124 includes lower cost-of-living increases for current and future retirees and was designed to help the retirement system for public safety officers recover from a major drop in the plan’s funded status.
  • Wayne County, MI: Recently upgraded by Moody’s. The rating agency noted “substantial reductions in retirement liabilities” as one of the reasons for the upgrade.

Supportive court rulings:

  • Georgia Supreme Court upheld Atlanta’s 2011 pension reform.
  • Colorado Supreme Court ruled in 2014 that the state could roll back cost of living adjustments for its pension plan participants
  • New Jersey Supreme Court ruled 6-1 and affirmed the state’s authority to suspend cost-of-living increases in public-worker pensions. According the court’s majority opinion “The Legislature retained its inherent sovereign right to act in its best judgment of the public interest and to pass legislation suspending further cost-of-living adjustments.”
  • California appellate court in August of this year, said benefit cuts are permissible if the pensions remain “reasonable” for workers.
  • Oregon Supreme Court: though the court overturned key aspects of 2013 pension reform, it ruled that it was legal to reduce the COLA for service rendered after the reforms were put in place. That means current and future employees will see lower inflation adjustments for benefits earned after May 2013.

We are not attempting to downplay the issue of unfunded pension liabilities; it is a serious problem in many places and too often pension pressures reduce the ability of an issuer to pay for needed infrastructure investments. This is a major factor contributing to the decline of new money projects over the past several years. But unfunded pension liabilities are not a hopeless situation faced by all obligors. As displayed above, there is both the political and constitutional ability to readjust pension obligations in certain localities and we expect further realigning in the future.

As we have noted time and time again, there is no one-size-fits-all model when evaluating municipal credits. Lien-by-lien, state-by-state, bond indentures and contracts differ vastly. It is important to have a thorough understanding of these differences when investing in today’s municipal bond market.

I hope you find this commentary helpful and if you have any comments or questions, please do not hesitate to contact your Investment Specialist or Portfolio Manager.

Sincerely,

Matthew P. Bernardi
Investment Specialist

Please visit our LinkedIn page or Twitter @Bernardimuni for future market updates or company news items.

(1) http://www.sifma.org/research/statistics.aspx
(2) https://www.census.gov/en.html

fall2016-frontpage.png
Market Update:
Fed fund futures priced in a low probability of a September rate hike and the Fed did not disappoint by holding rates steady. The municipal market saw yields drift higher for the quarter as the Fed fund futures market show an increased probability the Fed will raise rates in December. Yields on the AAA 2, 5 and 10 year parts of the yield curve increased by 21bps, 13bps and 14bps, respectively.
summer2016-frontpage.png
Market Update: Municipal bond yields decreased during the second quarter with AAA 5-year, 10-year, and 20-year yields falling 21, 37, and 49 basis points, respectively. Yields dropped dramatically after the United Kingdom (U.K.) voted to leave the European Union (EU), in late June. The Prime Minister of the U.K., David Cameron, resigned shortly after the announcement. The process for leaving the EU will take time and involve many discussions with other EU members over various trade agreements. It is too soon to tell who benefits from this decision, but it will create short-term uncertainty which will affect all financial markets.