Justin Formas, Director of Municipal Credit Research, summarizes the key points of the market update below. For an introduction to Justin Formas, please read the November 2010 President’s Letter. The United States municipal bond market has drawn a great deal of media attention recently, and for good reason. Weakened revenue streams, looming pension problems, historically large operating deficits in states like California and Illinois, and municipal bankruptcy threats – or actual filing in Vallejo, California’s case – have led many analysts to predict that the municipal bond market will be the epicenter of the next financial meltdown. Meanwhile, many industry professionals have countered by highlighting the traditional safety and security municipal bonds have provided over the decades. Regardless of the opinion, the considerable amount of noise has been at best unsettling to the individual municipal investor. Through the second quarter of 2010, individual investors held approximately 36.0% of outstanding municipal securities directly. An additional 33.8% of municipal securities were held indirectly through money market funds, mutual funds, and closed end funds. Take into account that level of individual ownership and it is not surprising to see investors advocating for greater accountability by the municipal market. This paper will focus on recent events that have emphasized the need for greater transparency, while examining the steps the federal government has taken to ensure municipal securities are held to the same disclosure standards as their corporate counterparts. Market growth outpaced disclosure According to the Securities Industry and Financial Markets Association (SIFMA), the size of the United States bond market through the second quarter of 2010 was $35.34 trillion. Municipal bonds accounted for $2.8334 trillion or 8.0% over that time period. All things considered, municipals are a fraction of the U.S. bond market that includes Treasuries ($8.508 trillion), mortgage-related debt ($8.9), and corporate debt ($7.27) totaling 69.8%. However, a closer look reveals interesting facts that clearly show how the bond market growth has outpaced the speed at which municipal disclosure standards have been set. Since 1996, the total US bond market has grown exponentially – increasing 189%. Meanwhile the municipal market has grown 125%. Additionally, there are reports that approximately $5 billion in municipal bonds are in default today. That figure would represent 0.18% of the total municipal market. Following the Great Depression, Congress passed the Securities Act of 1933 and the Securities and Exchange Act of 1934. The laws were enacted in an effort to provide investors with full disclosure regarding offered securities and to create a regulatory entity in the form of the Securities and Exchange Commission (SEC). Interestingly, municipal securities received special exemptions based on a preference to avoid federal and state jurisdictional interference. For the next several decades, debt issued by state and local governments was widely considered to be very low risk. The market consisted primarily of general obligation bonds, which carried a full faith and credit pledge of governmental entities. As a result, disclosure was minimal. The turning point However, with the introduction of new credit pledges, debt structures, and New York City’s financial crisis in the 1970s, municipal disclosure came to the forefront. An SEC investigation into New York City’s disclosure documents concluded that the City’s disclosures did not provide “the measure of disclosure mandated under the federal securities laws in the interests of the investing public” and “although municipalities have certain unique attributes by virtue of their political nature insofar as they are issuers of securities they are subject to the proscription against false and misleading disclosures.” These were important findings as they laid the foundation for one of the SEC’s rare filings against a municipality more than 30 years later. Subsequently in 1975, Congress passed amends to the Securities Exchange Act of 1934, essentially expanding the definition of “person” to include issuers of municipal securities. The amendment also made it clear that municipal entities were NOT exempt from the fraud provisions under prior Securities Acts. As part of the amendments in 1975, Congress established a limited regulatory scheme for municipal securities intermediaries. This included mandatory registration of municipal securities brokers and dealers, and the creation of the Municipal Securities Rulemaking Board (“MSRB”). Furthermore, in what could have been a watershed moment in terms of regulatory authority over issuers of municipal securities, Congress elected to approve Section 15B(d)(1) of the Exchange Act (commonly known as the Tower Amendment, after the late Republican Senator John Tower of Texas). The Tower Amendment specifically prohibits the SEC and the MSRB from requiring any issuer of municipal securities, either directly or indirectly, to make any filings with the Commission or the MSRB prior to the sale of securities. The MSRB was further limited in its ability to require any municipal issuer to furnish it or any purchaser or prospective purchaser with any documents. Fast-forward to 1983, and the $2.45 billion revenue bond default by the Washington Public Power Supply System. This particular default brought about SEC Rule 15c2-12, which requires underwriters participating in primary offerings of municipal securities of $1,000,000 or more to obtain, review, and distribute to investors copies of the issuer’s disclosure documents. The SEC also issued interpretative guidance concerning the due diligence obligations of underwriters of municipal securities. Derivatives lead to a default The municipal market once again evolved in the early 1990s as issuers developed a taste for sophisticated and complex interest rate products to hedge their overall debt portfolios. The most well known instance of municipal default and bankruptcy, Orange County, California’s involvement in the derivatives market caused an estimated loss of $1.7 billion of public funds. Prior to 1994, no major issuer had ever defaulted on a general obligation bond. Also along the lines of municipal derivative transactions gone wrong is Jefferson County, Alabama. Jefferson County had accumulated a municipal debt portfolio of approximately $4.6 billion. Of that amount, $3.2 billion was directly related to the County’s sewer system. The County’s refinancing arranged in 2002 and 2003 by JPMorgan Chase & Co. collapsed in 2008 when companies guaranteeing the floating-rate debt lost their top credit ratings because of losses on unrelated mortgage-backed securities. Interest rates on the sewer bonds rose to as much as 10 percent and derivatives tied to the debt worsened the crisis by further increasing borrowing costs. On March 7, 2008, Jefferson County failed to post $184 million collateral as required under its sewer bond agreements, thereby moving into technical default. Earlier this year, Jefferson County defaulted on $227 million of general-obligation warrants. If Jefferson County files for bankruptcy protection, it will be by far the biggest financial failure of a government entity in U.S. history. Recent municipal disclosure progress During the last few years the MSRB, in concert with the SEC, FINRA, and the Federal Reserve have made strides to improve municipal disclosure. For instance, last year the MSRB became the sole recognized information repository for municipal securities information. The MSRB’s Electronic Municipal Market Access, or EMMA, online repository system has received 126,200 continuing disclosure documents from 7,800 registrants. Of that total, about 85%, or 107,200, were mandatory disclosures. Around 41%, or 51,300, were for bond calls, while 32%, or 40,500, were annual audited financial statements. Roughly 9%, or 11,100, were for rating changes and 5%, or 6,900, were quarterly financial statements. During calendar 2009, the MSRB made more than 15,000 new official statements available to the public, bringing the number of official statements available on EMMA to nearly 300,000. The MSRB also collected data on more than 10 million municipal transactions worth close to $3.8 trillion. During the seven months ended December 31, 2009, the MSRB collected more than 61,000 continuing disclosure documents. However, until recently the historical lack of enforcement has diminished any true ability to adequately hold municipal issuers responsible. Specifically, the Tower Amendments have created a complicated set of disclosure rules without enforcement, as well as regulations that don’t directly address the issuers responsible for the disclosure. Three events show promise of better disclosure While it’s safe to remain fairly skeptical given the progression of municipal disclosures over the last 80 years, three events have occurred that show a modicum of promise. First, in November 2006, the SEC entered an order sanctioning the City of San Diego for committing securities fraud by failing to disclose to the investing public important information about its pension and retiree health care obligations in the sale of its municipal bonds in 2002 and 2003. This was the first time the SEC had ever formally filed charges against a municipality. To settle the action, the City agreed to cease and desist from future securities fraud violations and to retain an independent consultant for three years to foster compliance with its disclosure obligations under the federal securities laws. In formal offering documents, the City failed to inform investors that the City’s unfunded liability to its pension plan was projected to grow from $284 million at the beginning of 2002 to $2 billion by 2009. The City also failed to show that its liability for retiree health care was projected to grow to more than $1 billion. While it could be argued that the punishment doled out did not fit the crime, the SEC’s willingness to even charge a municipality with misleading investors was a milestone in and of itself. In August of 2010, the SEC charged the State of New Jersey with securities fraud. Similar to the San Diego case, the filing related to the State’s claim that it had historically been properly funding and accurately disclosing public employee pensions. The SEC contended that in addition to inadequately funding pension obligations dating back to at least 2001, the State’s disclosure documents omitted certain pieces of information critical to analyzing the pension systems overall financial condition. The SEC settled its suit with New Jersey by issuing a cease-and-desist order. The State accepted the order without admitting or denying the findings and no penalties were imposed. Furthermore, the SEC’s order did not name any individual state officials, nor the bond underwriters or other professionals associated the State’s financial statements and disclosure. Again, it would appear that all parties involved escaped with nothing more than a slap on the wrist, for now. The point here is that the SEC sanctioned a state. The third and most critical step in improving enforcement of municipal securities disclosure made its way into the Restoring American Financial Stability Act of 2010. As part of the 2010 Financial Reform Bill relating to municipal disclosure, section 976 (b)(4) states: “make recommendations relating to disclosure requirements for municipal issuers, including the advisability of the repeal or retention of section 15B(d) of the Securities Exchange Act of 1934 (15 U.S.C. 78o-4(d)), commonly known as the Tower Amendment. As the SEC pointed out in 2009 legislation proposing to repeal the Tower Amendments, the main goals are to gain greater control of municipal accounting standards, enhanced regulation of market intermediaries, and possibly changes to the composition of the MSRB that would make it a more “independent” self-regulator. The importance of issuers increasing the frequency of disseminating timely financial information to the municipal marketplace cannot be underscored. It does appear, in the near term, that many issuers will continue to struggle financially – making better disclosure standards a very high priority in our view. Munis remain attractive – but know thy bonds Municipal bonds will remain an attractive investment for many investors, especially given the probability of higher marginal income tax rates in the years ahead. For investors, the conflict at the center of the argument on whether to improve municipal disclosure comes from the registration exemption granted to municipal securities under the Securities Acts of 1933 and 1934. Historically, most retail and institutional investors have relied on the credit rating agencies and monoline bond insurers to perform the necessary due diligence and provide an adequate level of credit surveillance. As a result of the credit crisis, few monolines exist today and the faith in the rating agencies abilities to adequately represent creditworthiness has been shaken. Earlier this summer, shortly after the Restoring American Financial Stability Act was signed, a very unique thing happened in the marketplace. The credit rating agencies began asking issuers of all types of securities to not list their rating on offering documents for fear it could lead to an influx of lawsuits in the event that security soured. Markets were placed in a holding pattern. Few deals were priced until a resolution was found several days later. Initially, the credit rating agencies included municipal securities in their request, but upon further review came to the conclusion that because municipals are not registered securities under Acts of 1933 and 1934, they would not be exposed to the same legal concerns. This underscores an earlier point on municipal security ownership. It would appear that the government is pushing more responsibility on the investor by weakening third-party research firms and, therefore, it is sensible to make the necessary improvements to transparency and disclosure. The municipal bond marketplace is forever changed and will remain a very challenging financing environment for some time, in our view. The current dynamic underscores our long-held belief in the importance of knowing the underlying credit quality, deal purpose and deal structure of your municipal bond investments. At Bernardi Securities, Inc., our credit research analysts spend hours each week reviewing and updating our research database in these areas. Our experience from decades past tells us that this is still the best practice today and for the decades ahead. We hope you found this commentary helpful and thank you for your continued confidence. Sincerely, Justin Formas, CAIA Director, Municipal Bond Credit Research Department November 11, 2010
Many investors find it difficult to pay a price greater than par for a bond. We often find this hesitation is purely psychological and causes some investors to miss an advantageous structure in a low interest rate environment. This market commentary is written to explain why premium municipal bonds often offer value in today’s market — helping to justify paying above par for a bond. [Link to https://bernardisecurities.com/market-topics/interest-rates]
Premium bonds carry a coupon rate that is higher than current market yields. This causes the price of the bond to trade above the par value ($100) to bring the overall return in line with current rates. The higher coupon of premium bonds creates a number of benefits for the investor.
Reinvestment at higher rates
If rates rise, the higher coupon payment (i.e. cash flow) of premium bonds can be reinvested at the high rates. Take for example two $1,000,000 par amount portfolios. One is invested in premium bonds carrying 5% coupons, the other in par/discount bonds with 3% coupons. The first portfolio generates cash flow of $50,000 per year compared to the second at $30,000 per year. An additional $20,000 in cash flow from the premium bond portfolio is now available to take advantage of rising rates. $50,000 compounded at a 4% yield for 10 years amounts to $74,012 — whereas $30,000 amounts to only $44,407.
Less volatility
Higher coupon bonds are inherently less volatile than lower coupon bonds. Duration is a measure of the sensitivity of the price of a bond to changes in interest rates. The higher the duration, the more volatile a bond’s price changes as rates fluctuate. There are a number of factors affecting the duration calculation. One is a bond’s coupon rate. Because a relatively higher coupon returns cash flow to the bondholder sooner, it is a favorable input in the calculation and lowers the duration (volatility) of the bond.
Dearth of demand
There is a large contingent of the retail investor base that entirely avoids premium bonds. This reduces demand and makes them less expensive for others to buy at relatively higher yields. If you have read this far, hopefully you are no longer part of that crowd.
A defensive opportunity — with one caveat
The benefits of premium municipal bonds described above provide investors with both an opportunity and a defense mechanism in a rising rate environment. One caveat, however, should be noted about premium bonds — often these types of securities carry a short-term call date. Because of the high coupon, the likelihood of a call is often relatively high. Investors must take into account this possibility in the context of the overall portfolio structure — and should be properly compensated in yield return priced to that date.
Please contact us if you have any questions on portfolio strategies for a rising rate environment or would like a portfolio review.
Sincerely,
Matthew Bernardi
Bernardi Securities, Inc.
October 2, 2014
March 2, 2018
By Matthew P. Bernardi
Warren Buffett’s annual letter is one of the best insights into the mind of perhaps the greatest stock picker in history. His letters offer a great window into how he built a $500 billion conglomerate of businesses from a mere, mid-size textile manufacturing company. Today, Berkshire Hathaway intersects with our lives in myriad ways from auto insurance to underpants to home brokerage services. The man, however, is not without his biases as it pertains to financial markets and asset allocation, including a distaste for active stock management, investment bankers, and bonds.
The latter is the focus of this commentary and why individual investors should understand the context of Warren’s words when he stated bonds were “a really dumb” investment compared to stocks. Undoubtedly, he teaches us much about identifying attractive equity market business models- but remember that his investment objectives, risk tolerance, and investment time horizon are likely different than the average investor.
The composition of assets within a portfolio is primarily driven by the investor’s objectives. Objectives are primarily designed around achieving or maintaining a particular lifestyle. This may be a specific figure of net worth, income, gifting, or philanthropic activity. Mr. Buffett is driven by a very different purpose. His objective is driven by stockholders, who require continual quarter-over-quarter, year-over-year growth…in perpetuity. In a sense, Warren the man is really Warren the corporation and since a corporation’s lifespan is essentially endless, he will necessarily have different objectives than the ordinary investor. For most investors, income or net worth goals can be finite and established in order to get across the peace-of-mind finish line. Total return in perpetuity is not the sole driver of objectives for your average individual. Instead, locking in a fixed income and higher bond allocation is often necessary to achieve the peace of mind at a particular stage of life.
Objectives and time horizon drive portfolio risk, and risk drives security selection. Mr. Buffett needs to build a portfolio of assets that are likely to provide high levels of cash-flow far into the future and that can offset catastrophe insurance losses, which typically occur irregularly. On the other hand, our average investor holds a portion of their wealth in fixed income for two different life scenarios. Firstly, when they want to shelter a portion of the wealth they have accumulated throughout life. The second scenario is for investors who want serenity and optionality regarding their investment portfolios up to that point of ultimate wealth accumulation. This is in case of a job loss, large health expense, or even to take advantage of a stock market swoon during times of elevated valuations. Perhaps, the latter is why Mr. Buffett’s portfolio is currently 37% invested in cash and bonds, providing a bit of an incongruity to his “dumb” investment comment. That said, he has an added benefit of earning cash-flows from his various wholly-owned, underlying businesses to cover large one-off expenses. As for an individual investor, the potential of incurring an emergency or large one-time expense will drive an allocation to fixed rate, creditworthy bond assets.
To understand where Mr. Buffett falls on the risk-tolerance spectrum, look no further than the concentration of his stock ownership- both as a percent of his overall investment portfolio and in individual holdings.[1] This demonstrates Mr. Buffett is willing to stomach a much higher hit to principal than that of his competitors and even your average hedge fund manager. Of his insurance company counterparts, my calculations show Progressive Corporation having the next highest allocation to stocks at only 12% vs. 63% for Berkshire.[2] The fact he has been so successful designing a portfolio in such a way for so long is the essence of his genius. That said, this level of risk tolerance is unique and relatively very high.
Shareholder returns are directly connected to this portfolio risk and have experienced significant volatility in times of stress.
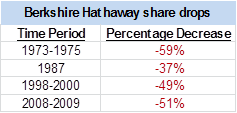
Source: Berkshire Hathaway 2017 Annual Report
Though long-term holders have obviously been rewarded, these types of stock swoons may be unpalatable for investors with a low tolerance for volatility. Also, most investors do not carry a perpetual investment horizon like that of Berkshire Hathaway, which will continue long after Warren Buffett and should invest as such. Assuming continued, long-term, economic growth and proper security selection, the company has time on its side to recover from economic calamities and short term volatility. Individual investors do not always have this benefit. Take for instance 1999-2009, which was a lost decade of stock returns – unlike for bonds.
To sum it up, Mr. Buffett’s anti-bond attitude must be understood in the context of his unique investment objectives, high tolerance for risk, and his perpetual holding period. He said it best while being interview on Monday morning by CNBC: “You will not be way happier if you double your net worth.” Is trying to achieve this with unnecessary or concentrated risk in any market worth sacrificing your peace of mind and long term goals?
[1] Buffett’s top 15 holdings of his publicly traded portfolio are 85.75% of the overall portfolio. Wells Fargo is the largest holding, followed by Apple at 17.16% and 16.47%, respectively.
[2] Source: Bloomberg
Please find below our portfolio management team’s 2018 Winter Municipal Market Review.
This provides an overview of current market conditions. If you would like additional information about our process or specific strategies, please let us know

January 2018
By Ronald P. Bernardi


The “Magic Square of 34” appears in the upper right side of Albrecht Durer’s 1514 copper plated masterpiece, “Melancholia.” The allegorical work is the subject of many interpretations. One interpretation asserts the scene depicts the age of Humanism, both its creative successes and unsolved frustrations.
Setting aside the questions evoked by the work, Durer’s magic square is its constant: the sum of 34 is found in the rows, columns and diagonals, the four corner numbers and the four center squares.
Year number 34 for Bernardi Securities began on October 1, 2017. Over these years we have enjoyed some great successes and experienced some frustrating uncertainties reminiscent of underlying themes of Durer’s “Melancholia.”
Like Durer’s magic square constant, there are certain Bernardi Constants our clients rely on and appreciate:
- Specialization and market expertise
- Ongoing awareness of client needs and forward thinking in order to serve better
- Organizational integrity resulting in an exemplary regulatory record
- Efficient and transparent cost structure
- Above average client performance and impeccable service
Our value-oriented strategy enables us to outperform often and is based on properly identifying and pricing risk. Market price is a reflection of future value discounted at a certain risk-based rate. “Where is the risk? Is the market correctly or incorrectly pricing the risk?” These are the two questions at the heart of our value strategy. In the answers lies the opportunity for clients.
We are grateful to our clients, friends, and partners who have helped make all of the above happen for nearly three and one half decades. Thank you for your continued confidence in our team and process.
*****
A HIGHLY REGULATED, LESS LIQUID BOND MARKET AND POSSIBLE INVESTOR VULNERABILITIES IN 2018
In recent years, new rulemaking affecting our industry has been prodigious. Recently, new and expanded rulemaking included these initiatives:
- “Best Execution”
- “Senior Protection”
- “Retirement Account Department of Labor Fiduciary Rule”
- “Retail confirmation disclosure” (May 2018)
Without question all are sensible additions. Adapting existing and creating new policies to adhere to these new rules and many others has been burdensome on broker–dealer and advisory firms. Not surprisingly, FINRA notes the number of broker-dealers has declined to 3,835 in 2016 from 4,578 in 2010. Additionally, a number of the larger bulge bracket firms have reduced their footprints or exited entirely from certain bond market sectors. According to Federal Reserve 2016 data, dealers hold approximately $20 billion less municipal bond inventory than six years ago (2010).
With fewer firms operating, we are cognizant that market liquidity will experience more strain in times of tumult.
Additionally, during this same period of time, mutual fund holdings of municipal bonds increased $978 billion.
Which begs a question: “in a market sell-off, how will muni mutual fund and ETF values fare when funds sell bond holdings to meet investor redemptions?”
The question is valid, in our view, and serves to highlight a primary advantage of our clients’ separately managed account (SMA) strategy.
FINRA’s 360 program was launched in 2017 and is the regulatory agency’s self-examination initiative aimed at assessing and improving the organization. This is a good development and we are eagerly awaiting word on its findings and resulting actions.
THE IMPORTANCE OF THE MUNI MARKET AND QUESTIONS INVESTORS SHOULD ASK
The municipal bond market has approximately $3.8 trillion in outstanding issues with 2017 new issue volume exceeding $400 billion. The market is a valuable funding source for state and local projects that affect residents’ quality of life. Much of the outstanding supply has financed our communities’ infrastructure: schools, libraries, town halls, county courthouse, water and sewer treatment plants, recreation facilities, airports, and hospitals.
Approximately 41% of outstanding bonds are held directly by individual investors (09/30/2017) and another 24% are owned indirectly by retail investors through mutual funds, exchange traded funds, closed end and money market funds according to Federal Reserve Board. Importantly, individuals are investing in our nation’s infrastructure when they purchase municipal bonds. They rely on the steady, secure interest payments as part of their investment and retirement strategies. These statistics show the important role individual investors serve in the municipal market making it incumbent on issuers, advisors, and broker-dealers to offer accuracy, completeness and transparency in their interactions with investors.
At Bernardi we are able to serve our clients as a portfolio manager either as an investment advisor or as a broker-dealer. Here are a few questions we encourage investors to ask their registered advisors and portfolio managers if provided through a broker-dealer:
- How are you compensated: fee-based, transaction-based, both ways?
- Will you itemize in writing all fees, expenses, mark-ups/downs?
- Are you subject to the fiduciary standard or suitability standard?
- Neither standard is conflict free; what are your potential conflicts under the fiduciary model, suitability model?
- How does your process and operating procedures mitigate potential conflicts?
- What is your investment process and philosophy: what is typical portfolio activity during the year?
- How do you source your bonds? How many middlemen are there between the bond you recommend to me and party you source it from?
- What are the costs of each iteration of question 7?
- What are your professional qualifications? What expertise and how extensive is firm’s network in this investment area? Can you access it and how?
- Who serves as custodian of my assets? Can I select another organization? If not, why? Do you have any conflicts in this area? Are you receiving direct or indirect compensation from your preferred custodian for client assets you direct to it?
This list is not complete, but it does cover many important issues. If answers to the above questions are not forthcoming, inaccurate or dismissive (“the question doesn’t apply to my model”), it indicates either an uninformed professional or someone appearing less transparent than what investors deserve.
At that point, the investor will have to make a decision whether to proceed with an incomplete picture.
THE BERNARDI MODEL – TRANSPARENT, HYBRID PLATFORM OFFERING CHOICE
We were heartened to read SEC Chairman Clayton’s remarks to the Senate Banking Committee last September which included an outline of the rubric he would use for an SEC sanctioned fiduciary rule. We have studied this complicated issue for many years and have spoken and written publicly about it.
Major themes of his remarks were that any new rule must preserve investors’ choices to use either an adviser or broker-dealer and that the standard needed to be applied consistently across all types of investment accounts. This is a solid foundation to help craft a much needed rule.
Leadership is about a willingness to consider new ideas, to engage thoughtfully, educate oneself, and execute a sensible solution to a problematical issue.
In 2000, Bernardi Securities, Inc. (BSI) formed Bernardi Asset Management (BAM), a SEC registered investment advisory firm. It offers fee only, fiduciary portfolio management strategies and is a wholly owned subsidiary of BSI. BAM was formed to complement our existing services so we could offer investors a choice of portfolio management options as a dually-registered firm.
The options are:
- Non-fee, transaction based bond portfolio management through BSI adhering to suitability, best execution, know your customer and other standards
- Fiduciary, fee-only portfolio management offered through BAM
Both portfolio management platforms rely on our internal municipal bond credit analysis process. It is robust, nuanced and time tested. The portfolio management team is the same for either option and the process is very similar. The options provide choices and are designed so our clients have cost effective access to our specialized management services in a way that best suits their situation.
We would be happy to discuss either option with you in detail.
Happy New Year.
Sincerely,
Ronald P. Bernardi
President and CEO
Bernardi Securities, Inc.
January 11, 2018
December 2017
By Matthew P. Bernardi
Tax reform largely left the municipal bond market intact, though a bit squeezed, and it remains an attractive space for individual investors. We are satisfied with the outcome and are also grateful as American citizens and taxpayers that Congress largely left the market unhindered in its ability to fund the bulk (~75%) of our nation’s infrastructure.
Municipal bond investments serve two main purposes in any investor’s portfolio: principal preservation and a dependable stream of income exempt from federal income taxation. Another attractive feature that is often overlooked, is the direct impact investors have on local communities by providing attractive financing for essential public purpose projects.
After great efforts by local leaders and constituents during the reform debate, Congress heard this message: preserve tax-exemption because it plays a paramount role in financing our nation’s infrastructure and keeps costs low for taxpayers and community residents and businesses across the nation.
Impact on Market Dynamics
From a demand perspective, we believe tax rate changes will have a limited impact on individual investor interest. Below is a side by side graphic of changes to rates and income levels as a result of tax reform.
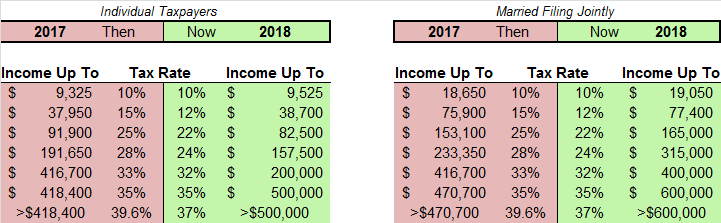
Source: Tax Cuts and Jobs Act
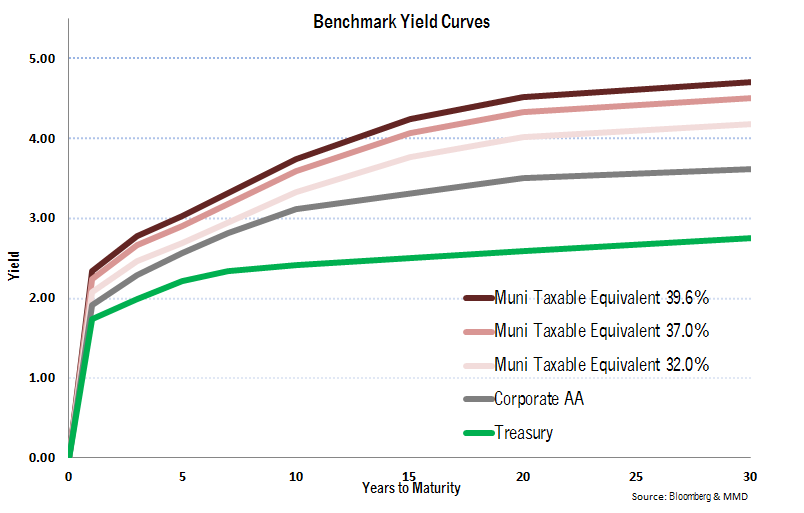
For top earners, lower top tax brackets will slightly reduce the attractiveness of tax-exempt securities. The tax cut is minor and we do not believe it will have a meaningful impact on demand from this investor group. Taxable equivalent yields barely budge when taking into account the cut from 39.6% to 37% – even all the way to 32% (see graph below). Additionally, the 3.8% Medicare tax on investment income does not affect municipal interest.
For top tax bracket individuals, non-taxable bond yields remain more attractive than high grade fixed income alternatives.

As of 12/29/2017
That said, many investors who previously fell into the 28% bracket may realign in 22-24% range. This investor group should consider our taxable strategies. Please discuss details with your Bernardi Investment Specialist.
The graph below depicts the attractiveness of taxable municipal yields compared to taxable equivalent yields (TEYs) at the 24% tax bracket.
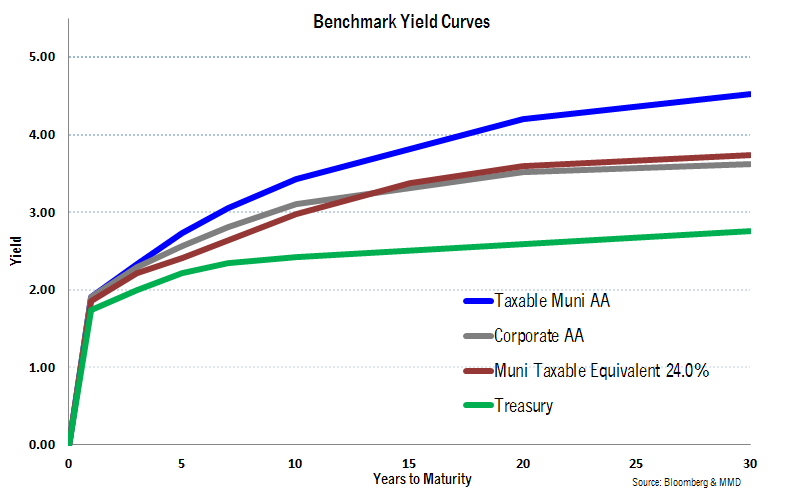
As of 12/29/2017
When designing portfolios, the balance between tax-exempt to taxable municipals depends on one’s projected tax rate, which we aim to project over the average maturity of the portfolio. In these cases, a dynamic approach to buying tax-exempt and taxable securities most likely provides the most attractive after-tax returns.
The muted effect on demand from these minor changes in individual tax rates may contrast sharply with the steep reduction in corporate tax rates, which are also permanent unlike the new individual tax rates. Demand for tax-exempt bonds likely will be significantly lower from institutional investors that are currently paying near or the top corporate tax rate. It also has the potential to make the Bank Qualified status of bonds an unnecessary qualification for issuers. The great unknown is whether the drop off in demand from this sector will push bond yields higher.
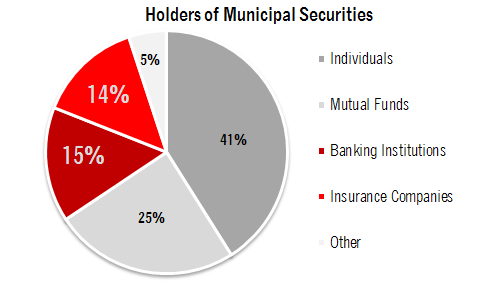
Banking and insurance companies own almost 30% of the market. With corporate tax rates falling from 35% to 21%, demand for municipals from these types of institutions will decrease unless yields adjust higher.
A positive of the tax reform law, from a supply perspective, is that Congress maintained the ability for issuers to finance certain projects through Public Activity Bonds (PABs). This will continue to allow hospitals, affordable housing projects, and airports to finance valuable infrastructure projects with tax-exempt bond issues.
The elimination an of issuer’s ability to advance refund debt is the most significant setback coming from the tax bill. Prohibiting issuers from executing economic re-financings is a flaw in the law. Well managed issuers should have the ability to take advantage of low yields and refinance debt when significant savings are available. Eliminating this option for issuers will have a meaningful impact on supply in 2018.
From a credit quality perspective, tax reform will hopefully drive economic growth and make America a more attractive place for corporations to locate and invest. Lower income taxes may also stimulate consumer spending, thereby providing a boost to sales tax revenue. These economic catalysts, should they occur, will certainly benefit fiscal balances and the underlying credit health of the average municipality.
*****
Municipals will continue to play a vital role in one’s asset allocation and an important role in building this country. That said, a dynamic approach may be needed when investing in the market based on the yield curve. Please reach out to your investment specialist with any questions you have about the impact tax reform has on your municipal portfolio.
General Obligation Bonds, Election of 2016, Series 2017A
The Bonds were upgraded to AA- from A+ by S&P in coincident with the issuance. The Bonds were issued to finance a capital improvement project, and are payable from unlimited ad valorem property taxes levied and collected by Contra Costa County. The project includes financing the acquisition and construction of educational facilities, adding classrooms to prevent overcrowding, and providing classroom instructional technology. In accordance with section 53515(a) of the California Government Code, the Bonds shall be secured by a statutory lien on all revenues received pursuant to the levy and collection of the tax for general obligation bonds issued under the 2016 Authorization. The lien shall automatically attach without further action or authorization by the District or the County.*
The District is located in the City of Oakley in Contra Costa County, northeast of San Francisco. Enrollment has seen growth of 8% since Fiscal Year (FY) 2011, totaling 5,015 students. Since FY2011 assessed valuation has grown 48% to just over $3.5 billion in FY2016, equating to $85,127 per capita. The District tax base is diverse with the top 10 taxpayers accounting for 4.87% of FY2016 assessed valuation. The City of Oakley’s wealth indices far outpace both the state and national averages, with median household effective buying income at 120% and 139% respectively in 2016.
As of 8/23/2017, direct debt of the District (including the 2017A issuance) totals $41.3 million, 1.1% of FY2016 assessed valuation. The Districts unfunded OPEB liability totaled $6.04 million as of 9/1/2015. The District participates in both the CalSTRS and CalPERS pension systems. As of 6/30/2016, the District’s net pension liability for CalSTRS was $30.2 million (77% funded), while the District’s net pension liability for CalPERS was $7.7 million (83% funded).
The District’s finances likewise appear solid. The District’s 6/30/2016 balance sheet reports a General Fund Cash balance of $12.9m, or 28% of General Fund expenditures. The District’s 6/30/2016 General Fund balance of $13.3m is a robust 28% of General Fund revenues. Under the provisions of the state’s Assembly Bill 1200, each school district is required to file interim certifications with the county office of education as to its ability to meet its financial obligations for the remainder of the then-current fiscal year and, based on current forecasts, for the subsequent two fiscal years. The county office of education reviews the certification and issues either a positive, negative or qualified certification. A positive certification is assigned to any school district that will meet its financial obligations for the current fiscal year and subsequent two fiscal years. The District’s 2nd Interim Report for fiscal year 2016-17 was adopted on 3/15/17 and certified as “Positive.” The District has not received a qualified or negative certification in any of the last five years.**
*See pg. 4 of the OS
**See Appendix B, pg. 4 of the OS

Bond yields have remained range bound over the past four months. Through the first two months of the third quarter, bonds continued their rally. The 10-year Treasury started the quarter yielding 2.31% and by 8/31 had fallen to 2.15%. Yields reversed course during the last month of the quarter with the 10-Year Treasury hitting 2.46% on 10/26. Since then, yields have fallen with the current 10-Year yield back to where it started at the beginning of the 3rd quarter at 2.32%.

October 2017
By Matthew P. Bernardi

The tragic storms over the past months highlight the concept of “event risk” investors face while investing in the municipal bond market. Event risk is a term more closely associated with the stock or corporate bond markets, where an underlying credit can be significantly impacted on a short term basis by an unforeseen event. Substantial credit deterioration in the municipal market traditionally resembles a slow moving train wreck (e.g. Detroit, Puerto Rico, Hartford). That said, events like Irma, Harvey, and Maria can create massive shocks to the system, potentially impairing fiscal balances enough to create distressed credits from an otherwise healthy or stable state. What can we learn from such events and their impact on the municipal market? Also, how does sound credit analysis account for such risk?
“How did you go bankrupt? …Two ways. Gradually, then suddenly.”
– The Sun Also Rises by Ernest Hemingway
Although municipal defaults are historically rare, the effects of two recessions in ten years and anemic growth post the “Great Recession” has taken its toll on mismanaged localities. Therefore, general obligation default rates are relatively higher in the last seventeen years compared to the previous fifty.[1] The silver lining in the credit analysis process is that a solid process usually detects significant credit deterioration long before a default or bankruptcy occurs. The pace of credit deterioration is also relatively slow compared to corporates. Moody’s notes in the their latest US Municipal Bond Defaults and Recoveries, 1970-2016 report that “Rating Transition Rates” are much higher for corporates compared to municipals. For example, after one year, 1.93% of AAA rated municipals are downgraded to AA, while 11.78% of corporates in the period 2007-2016. The slower fiscal transition speed of municipals is due to the inherent stability of their cash flows, multiple levers available to close gaps, and –for more impaired credits – “kick-the-can” mechanisms which can delay the day of reckoning.
However, the event risk of a 1-in-1,000 year storm can speed up those rating transition rates to the downside. Offsetting this risk are significant safeguards and backstops already in place, which indirectly protect bondholders.
Federal and State Aid: A $15.2 billion hurricane relief bill passed Congress to aid victims of Harvey in Texas and Louisiana. Irma and Maria victims are next in line, with additional funds needed for future Harvey recovery efforts. We should be getting a more exact figure this month from Congress on additional aid. Some have speculated at least $100 billion will be needed for Harvey victims alone.
Federal aid plays a substantial remedial role. In fact, Houston’s controller noted that the city will not need to sell any new bonds for storm rehabilitation capital projects. He noted that FEMA reimburses anywhere from 75-90% of costs incurred, significantly reducing the burden on local taxpayers.
Other forms of federal aid include the Community Development Block Grant program, which has distributed more than $50 billion in disaster recovery funds since 1993 and made up 17% of the $120 billion in federal disaster aid paid out after Hurricane Katrina in 2005. The program gives states much more flexibility in distributing aid to localities to help them rebuild after disasters. Additionally, FEMA partners with the U.S. Small Business Administration (SBA) and offers low-interest disaster loans to homeowners, renters, and businesses of all sizes.
Local units of government receive approximately 80% of their revenues from property taxes. These federal and state aid sources help to stymie significant property devaluation after catastrophes, which help to stabilize the underlying credit of their outstanding debt.
Private and public insurance: private home insurance is another stabilizing factor in preserving local taxing capacity and valuations, as it incentivizes homeowners to stay current on property tax payments. While wind damage is normally covered in basic homeowners insurance, “acts of God” (natural disasters) are not covered. However, homeowners whose property is located in designated flood zones are required to buy a policy – which is enforced by mortgage-issuing banks. Many residents purchase supplementary flood insurance as well.
Although 20% of Houston-area homes are covered by flood insurance, it has been noted that most of southeast Texas was not considered high-risk flood zones, therefore, FEMA-mandated flood coverage was not purchased. It will be interesting to see if FEMA readdresses the zoning policy in light of recent storms.
Public insurance plays an important role as well as municipalities are covered by their own carriers. Baytown, TX recently noted it expects to cover most of its cleanup costs through a combination of FEMA and insurance reimbursements. State programs, such as Florida’s Hurricane Catastrophe Fund, also help to stabilize the insurance market in times of stress.
Importance of credit research and portfolio diversification
The event-risk produced by these extremely powerful storms brings credit analysis to the forefront when constructing and managing a portfolio. Financial flexibility and market access are the two paramount metrics when analyzing an issuer’s ability to fiscally endure a natural disaster. Geographic diversification within your portfolio is important as well to protect against such occurrences. We have found many investors like to invest close to home for familiarity and social reasons (outside of taking advantage of the potential double tax-exempt feature). We highly recommend diversifying beyond your given state and region. For example, our Intermediate strategy has a top single state holding of 12.53%.
The potential dichotomy of the U.S. Virgin Islands and Houston’s post-storm fiscal recovery demonstrates the importance of fiscal flexibility. The USVI was already a downtrodden credit coming into hurricane season. Unfortunately, the recent storms have the potential to be the coup de grace for the credit, as they are a direct hit to the vital tourism industry. The ability to access credit on the open market will be severely hampered as well. In contrast, Houston does not appear to have a suffered a significant fiscal impact and has no need to add leverage for revitalization efforts.
Storm stimulus
Natural disasters followed by significant amounts of federal aid may also revitalize an otherwise weak local economy. It is interesting that New Orleans has emerged as a healthier credit in the twelve years since Katrina – in large part due to the significant amount of federal aid received. We think the potential for a comparable Virgin Island rebirth is unlikely, nor worth speculating on for the mattress-money allocation of your portfolio.
****
In conclusion, “acts of god” certainly present event risk for the municipal bond market. However, a combination of bottom-up credit analysis, diversification, and insurance-mechanisms should protect portfolios from suffering permanent damage.
Matt Bernardi
Investment Specialist
[1] Moody’s Investors Service: US Municipal Bond Defaults and Recoveries, 1970-2016, June 27, 2017

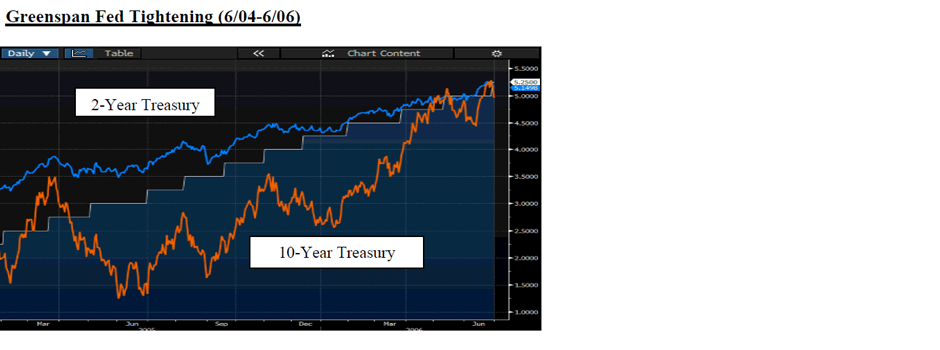
The second quarter was a wild ride for the 10-year U.S. Treasury note. The 10-year started the quarter yielding 2.35%, rose as high as 2.41% and fell as low as 2.14%. It finished the quarter at 2.31%. The 2-year U.S. Treasury dropped 14 basis points (0.14%) over the quarter, causing the yield curve to flatten by 18 basis points (see graph below). The Federal Reserve raised the Federal Funds rate by 25 basis points in June to a range of 1.00% – 1.25%. Historically, Federal Reserve tightening cycles (rising rates) are accompanied by a flattening yield curve. This once again appears to be the case.