The Accumulation of Debt
July 5, 2018
By Matthew P. Bernardi
“[Avoid] likewise the accumulation of debt”. – George Washington
Since the financial crisis, municipal bonded debt outstanding has increased at a snail’s pace of 0.51% per year.[1] With corporate debt growing at an annual pace of 5.33% and Treasuries at 10.18%, it appears the average municipal government has demonstrated relative fiscal restraint. In the 7 years leading up to the 2008-2009 financial crisis, municipal debt grew at an average annual pace of 7.95% vs. corporate of 6.45% and 6.34% for the Treasury.[2] What accounts for this tamed post-crisis growth trend? Is it truly fiscal prudence, or can we attribute the slow growth to other market dynamics?
The post-crisis boom in corporate and treasury issuance is due to variety of factors. Corporate America has aggressively taken advantage of low rates induced by the Fed. Along with increased profitability and tax reform, higher debt issuance has allowed S&P 500 companies to massively increase dividends and stock buybacks. As an example, Walgreens Boots Alliance has increased long and short term debt from $2.5 billion in January of 2009 to over $15 billion today.[3] On June 28th, the company announced a $10 billion stock buyback, paired with a 10% increase to their dividend.
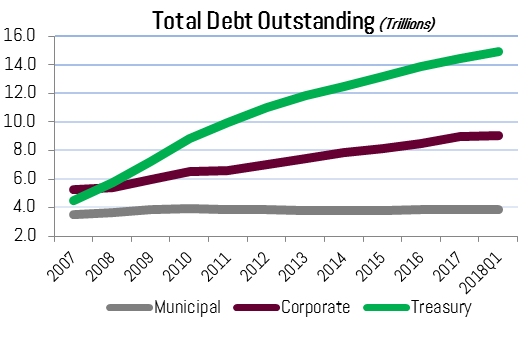
Source: SIFMA
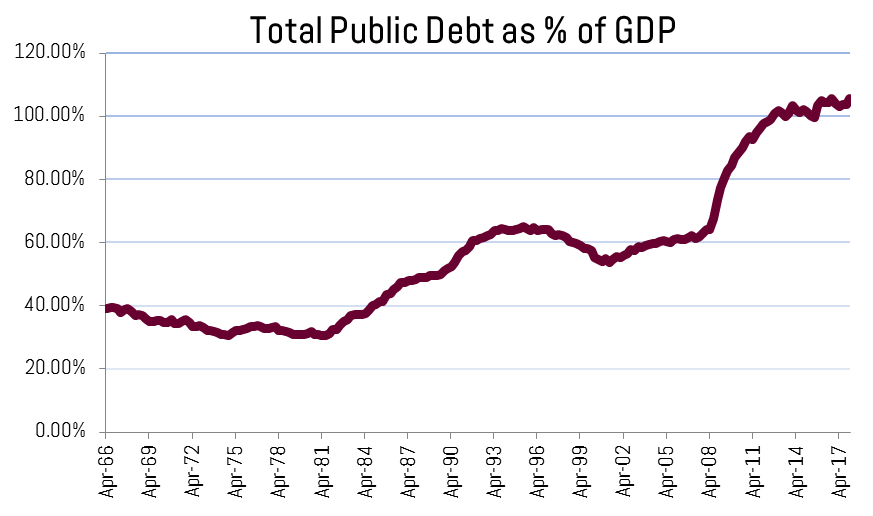
Our national debt has also skyrocketed. Treasury debt held by the public grew to $7.2 trillion from $5.7 trillion – or 25% – from 2008 to 2009. This pace of growth has far exceeded GDP growth and now amounts to a total of just under $15 trillion.[4]
In recent years, municipal issuers have not tapped the market nearly aggressively in what appears to be an effort of fiscal restraint. For bondholders, it should be comforting to see low growth rates of indebtedness during a mild economic growth cycle. However, the pace of growth appears abnormally low and we believe there are more forces at play keeping public issuance subdued.
Weights on municipal debt issuance
Though debt liabilities for issuers appear under control, unfunded pension liabilities have increased at a greater pace since the crisis. In fact, in an effort to increase accounting transparency, GASB implemented Statement No. 68 in 2014. This requires state and local governments with defined benefit plans to report their net pension liability on the balance sheet. This enhanced standard certainly helps the credit analysis process: we consider debt + unfunded pension liabilities per capita as an important credit metric for vetting issuers which have both i) high unfunded liabilities and ii) limited statutory reform flexibility.
Unlike bonded debt outstanding, unfunded pension liabilities are complicated projections based on a multitude of assumptions over multiple decades. The crisis and resulting stock market swoon put a dent in the asset side of the pension liability calculation, therefore, issuers have been forced to allocate incremental dollars to pension servicing rather than debt servicing, leading to lower total issuance. Future liabilities cannot be measured purely by quantitative means, especially due to the occurrence and potential for pension reform. Though pension reform has taken hold in various parts of the country, its impact will take years, if not decades, to play out. In the meantime, pension funding ratios will remain historically low, therefore, required contributions high. The higher than average contributions will continue to crowd out other forms of spending, such as debt servicing.
Looking further under the hood, a second reason for subdued public issuance is the growth of the bank loan market. In 2014 S&P estimated that direct loans could account for as high as 20% of municipal issuance.[5] Increased direct loans as a percent of the municipal issuance likely has been a reaction to a higher regulatory burden on issuers and more stringent capital rules placed on banks under Dodd-Frank. In our opinion 20% seems high, but we will use it for the analysis below.
Source: Federal Reserve Bank of St. Louis
Assuming S&P’s 20% figure, this would equate to an additional $789 billion in municipal debt issued since the crisis (but instead held directly by banks as a loan rather than a security). That would mean the market grew to $4.63 trillion from $3.65 trillion in 2008. Or a growth of 2.66% per year vs. the 0.51% increase per year noted in the introduction. Much higher, but still lower than the previous growth cycle and still paltry compared to corporations and the Treasury. [6]
Will the low issuance trend persist?
Looking forward, a combination of bank regulatory reform, characterization of municipal securities as 2B HQLA assets, enhanced requirements for Rule G-34, continued economic growth, and tax reform should all serve as tailwinds for public market debt issuance. That said, 2018 will be an abnormal year due to the elimination of the advanced refunding capability. New money issuance, on the other hand, is projected to be at its highest level since 2010, which was the culmination of the Build American Bond program. New money issuance is still well below pre-crisis levels, but up 19.2% year-over year through May.
****
In summary, taking into account the growth of unfunded pension liabilities and the private debt market, the low rate of municipal public debt issuance makes more sense, but does not entirely explain the drop-off. Fiscal prudence on the part of state and local officials could make up the balance and is certainly a credit positive for the municipal bond market, both in of itself and relative to other high-grade fixed income asset classes.
—————————-
[1] 2008-Q12018, SIFMA US Bond Market Issuance and Outstanding https://www.sifma.org/resources/research/us-bond-market-issuance-and-outstanding/
[2] Average municipal growth figure excludes 51.3% growth rate from 2003 to 2004 following the Federal Reserve’s revision of prior undercounted figures.
[3] Source: Bloomberg
[4] Source: SIFMA Outstanding U.S. Bond Market Debt
[5] Alternative Financing: Disclosure Is Critical To Credit Analysis In Public Finance, Standard & Poor’s Ratings Services. February 18th, 2014.
[6] Source: Federal Reserve Bank of St. Louis