The Yield Curve: Where we have been and possibly going
October 10, 2018
The U.S. economy is firing on all cylinders right now. Small business confidence has reached all-time highs, jobless claims are near 49 year lows, while household net worth continues to climb into record territory. Federal Reserve Bank of New York President, John Williams, recently noted the economy is “about as good as it gets.” This growth spurt appears in what is now the second longest expansion cycle in history (111 months). Importantly, today’s growth is paired with stable inflation, which keeps the Fed’s dual mandate in check and enables a patient path of rate hikes in the near future. When will the rate hikes end and what will be the resulting shape of the yield curve? These are two pressing questions for market participants…and even the Fed itself. That said, based on history, the current shape of the yield curve indicates a recession is still years away.
Barring an inflation surge or sustainable GDP prints above 3.00%, the Fed Funds Rate (FFR) is awfully close (currently 2.00-2.25%) to the Federal Reserve Board’s long term projection of 3.00%. Assuming this cycle’s trends continue (GDP growth has averaged 2.20% since 2010) and ongoing 0.25% rate hikes, the drift to a flatter yield curve will continue (i.e. the difference between short term and long term rates moves lower).

Source: Bloomberg
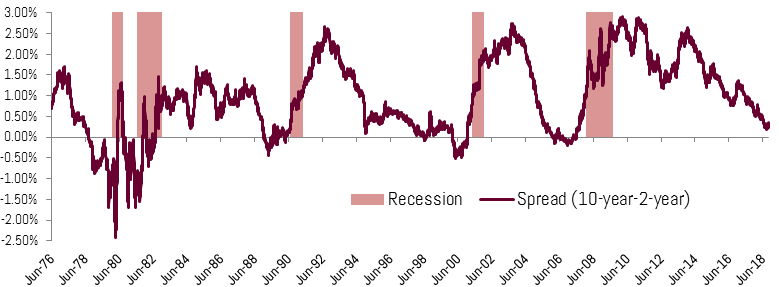
The difference in yield between the 2-year Treasury and 10-year has moved from 1.36% in late December 2016, to a mere 0.33% today. At this low of a spread level and with history as a guide, this signals tightening financial conditions and a higher potential for recession.
In fact, over the past 40 years, every recession has been preceded by an inversion of the yield curve (when long term rates are lower than short term rates). We are not at this point yet, but current yield curve dynamics and the trend worries some market participants. Therefore, it is not surprising that calls for a looming recession have grown louder in recent months.
The reason for the correlation between recessions and the steepness of the yield curve rests somewhere between the curve being both a source and a signal of the oncoming recession. As a source, a flatter curve reduces bank profitability and the willingness to lend. Banks often borrow at short term rates and lend at longer term yields. As profitability diminishes so does their inclination to lend, therefore, reducing economic growth potential of certain elements in our debt-reliant economy as loan availability for small business financing, car loans, and mortgages is reduced. The process of debt-fueled growth, therefore, is slowed leading to declining asset values, incomes, and overall growth. As a signal, the flatter yield curve demonstrates a central bank more concerned about price pressures (inflation) than the near term growth trend. Think the late 1970s to 1980s Volcker-lead Fed, which sacrificed near-term growth in order to tame inflation by significantly increasing short term rates.
Is this time different?
The current shape of the yield curve and past trends point to a recession that may be years away. As the graph below shows, the yield curve typically inverts years before a recession sets in. The past five recessions have all followed this trend. For example, as the Greenspan-led Fed began hiking rates in the summer of 2004, the difference between the 2-year and 10-year treasury went negative/inverted (i.e. the 2-year yield was higher than the 10-year yield) in December of 2005, while the recession began in the beginning of 2008, 2 years after the inversion first occurred.
Source: Bloomberg
The ultimate monetary policy tightrope walk occurred in the 1990s, which supported the longest expansion on record, 120 months. In early 1994 the Fed tightened the FFR by 300 basis points (from 3.00% to 6.00%), which is the same goal as today’s Fed in terms of rate of change (though from 0% to 3.00%). This caused a flattening of the 2yr/10yr curve from 1.60% at the commencement of the tightening to 0.08% at the end of 1994. The curve then steepened to 0.87% as the Fed reduced short term rates, before meandering its way to an inverted curve in 2000 as the Fed began another hiking cycle. The Fed actually hiked three times after the curve inverted to 5.75%, 6.00% and finally to 6.50% on May 16, 2000. Eventually the tech bubble popped and a recession hit in spring of 2001. Perhaps Fed Chair Jerome Powell is aiming to mirror the Greenspan-led fed of the 1990s and break the 120-month growth record.
Source: Bloomberg
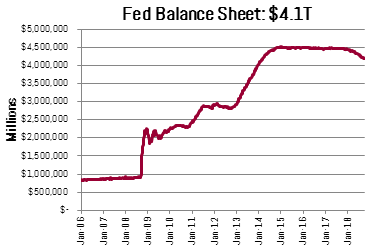
Past trends certainly provide insight about the future, though as Mark Twain once said, “History doesn’t repeat itself, but it often rhymes.” This is no less true today due to the classic tightening cycle paired with an unprecedented level of global central bank easing and balance sheet growth. Though the Fed is the world’s most powerful central bank for the world’s biggest economy, the central banks of Japan, Europe, and China remain in easing mode and cumulatively hold multiples of financial assets compared to the Fed. This means that our rates are intertwined with German Bunds (10-year yield at 0.55%) to Japanese Government Bonds (10-year yield 0.14%).
Because history does not perfectly repeat, no one should take for granted that a positive sloping yield curve means no imminent recession. Central banks had never reached the “zero-bound” (zero to negative short term rates) since the Great Depression. Therefore, higher rates, even with a somewhat normal sloping yield curve, may cause enough financial stress to cause a recession. We may not truly understand how reliant the global economy is on the zero-bound. This would be the first recession in 40-years NOT preceded by an inverted curve. Alternatively, if today’s recent growth spurt of 4%+ GDP is sustainable on a medium term basis and global growth follows en suite, we would expect gradual steepening of the curve leading to higher long term rates relative to short term rates…further extending the growth cycle well past the 120 month record set in the 1990s. We actually have experienced this dynamic over the past month following somewhat hawkish Fed-speak and continued strong economic numbers.
Today is certainly a long and thin tightrope for Jerome Powell and the Federal Reserve Board to walk – while the path forward is hazy at best. Based on historical trends, a recession is still years away, though the unprecedented nature of central bank intervention may have transformed traditional correlations.