Beware of the Average Benchmark
January 18, 2019
There are many facets and varieties of our active management approach to municipal bond portfolios. Credit analysis, ladder positioning, strategies offered, and tax-loss harvesting to name a few. Another important aspect of active management is the allocation to (and avoidance of) specific geographies relative to the benchmark. Considering the pitfalls of bond benchmark construction, tax reform, state-by-state tax regimes and credit trends, we believe geographical positioning plays a crucial role in providing investors higher levels of income relative to passive securities (index funds).
“Inherently faulty benchmark construction may be the fire boiling the passive pot of bond investors (frogs) over time. “
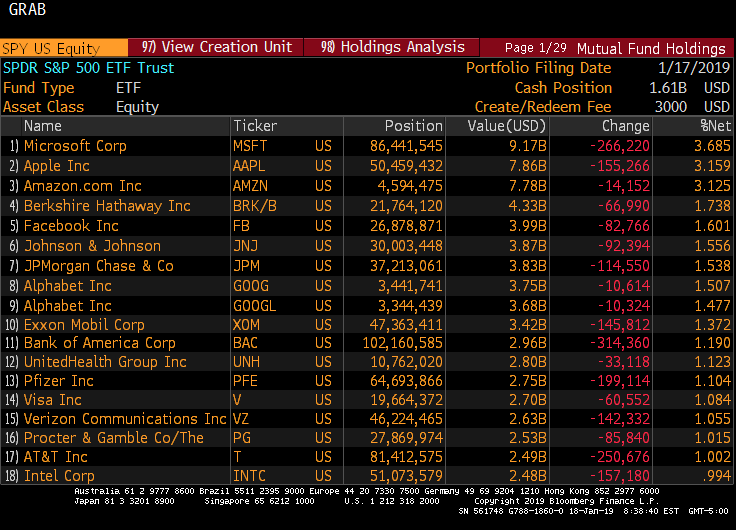
Unlike stock benchmarks, bond benchmarks are often misaligned with the average municipal bond investor’s investment profile. Company stocks within the major equity benchmarks – such as the S&P 500 – are weighted based on market cap.[1] The market cap of a stock is determined by the historical success (or lack of) of a company. Therefore, the most successful companies such as Microsoft, Apple, Amazon, and Google (2 share classes) are the largest components of the S&P 500. So, when you buy the SPDR S&P 500 ETF (ticker: SPY) – which is passively indexed to the S&P 500 – you are automatically allocated in such a way to today’s largest and most successful companies (though this does not necessarily mean tomorrow’s). Bond benchmarks work much differently.
Unlike the stock market where the index is dedicated to the winners, municipal bond indexes are allocated to the largest issuers of debt. Often, higher debt issuance is inversely related to credit health. Additionally, the bulk of the largest issuers have tax regimes that make it unappealing for out-of-state investors to own their bonds (high state income tax rates + double tax-exempt bonds).
The Barclays 7-year municipal benchmark and top state allocations are as follows:
| State | % |
| CA | 15.76% |
| NY | 15.60% |
| TX | 9.10% |
| IL | 4.95% |
| FL | 4.28% |
Source: Bloomberg
Concurrently, Vanguard’s passive Tax-Exempt Bond ETF (Ticker: VTEB) is similarly invested:
| State | % |
| NY | 20.00% |
| CA | 14.00% |
| TX | 10.80% |
| NJ | 5.00% |
| IL | 4.90% |
Source: Vanguard
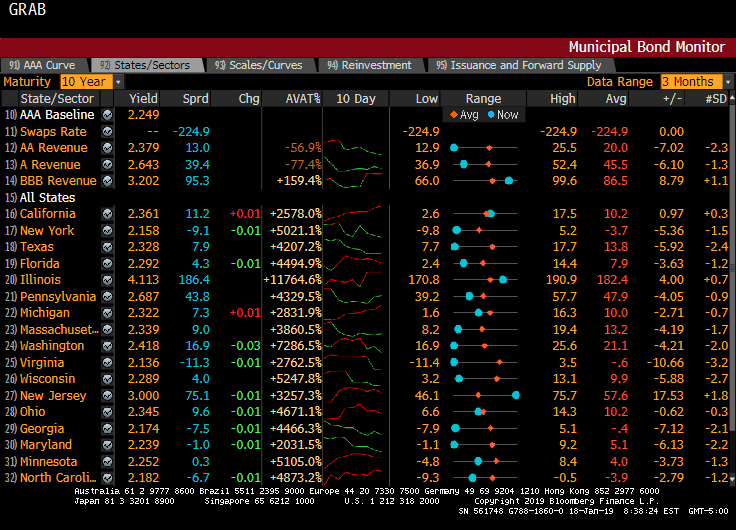
From an income perspective, if you are a resident of a state with no or a low state income tax rate (i.e., Florida, Texas, Illinois, etc.), there are ample reasons to avoid investing a significant percentage of your portfolio in high state tax issuers like New York and California – which offer double, sometimes triple, tax-exemption to investors residing within those states. These two states alone, make up over 31% of the benchmark and 34% of VTEB. These tax regimes, paired with the recent tax reform and the need for tax-exempt income, cause the average NY or CA bond to trade at yields very close to the benchmark. See the “Sprd” (spread) column in blue below, which notes the difference in yield between the given state’s 10-year bond and the AAA-rated Bloomberg benchmark tax-exempt yield. You will notice that the State of New York trades 9.1 basis points (0.091%) below the benchmark.
A non-NY resident does not benefit from double tax-exempt New York bonds and, therefore, should largely avoid them and the benchmark. There are plenty of opportunities for higher tax-exempt yields elsewhere.
However, when one passively invests (such as in VTEB or the MUB iShares ETF) in the municipal market you are in fact often allocating funds to larger, lower yielding issuers. Bernardi’s active Separately Managed Account (SMA) approach not only aims to avoid these overvalued states (for out of state residents), but aims to allocate to undervalued geographies, as well.
Don’t Be the Proverbial Frog
The dangers of bond benchmark construction and passive investing may become apparent in the coming decades as it pertains to U.S. Treasuries. The U.S. government’s projected budget deficit is expected to widen from fiscal-year 2018’s 3.8% of GDP to 4.6% in 2019.[2] This means more debt issuance is needed to fund the deficits, and this is paired with a Federal Reserve offloading its Treasury holdings by $30 billion per month (plus $20 billion in mortgage backed securities). How the market will digest the additional debt is one of the most prominent questions for current bond investors. As the Treasury floods the market with issuance, it will not only crowd-out other forms of debt, but it also means a larger percentage of passive investment vehicles will be allocated to Treasury bonds.
This situation has two major implications for investors. First, because passive benchmarks continue to grow in popularity and will be robotically buying more Treasuries, this dynamic may lessen the impact of “runaway deficits” and resulting spiking yields forecasted by contemporary bond vigilantes.
Secondly, investors may be exposed to an unattractive allocation of bonds as they’ll be forced to own a greater percentage of Treasury bonds simply because the Treasury is issuing more debt. Unless the federal government can attain a more stable fiscal path, it is not implausible for it to lose the coveted Aaa rating by Moody’s. S&P rates the credit AA+ after downgrading in 2011 during the debt ceiling crisis. If the U.S. government’s credit trend continues to regress, inherently faulty benchmark construction may be the fire boiling the passive pot of bond investors (frogs) over time.

***************
[1] Side note: This is why the Dow isn’t the greatest indicator of market moves as the index is weighted based on the nominal price of the stock, not market cap. For example, 3M has almost double the weighting of Microsoft simply because the stock trades at $194 per share vs. $107 for Microsoft. Microsoft is a much larger company, however, with a market cap of just under $825 billion vs. $113 billion for 3M.
[2] Moody’s Weekly Market Outlook, December 20th, 2018. https://www.moodys.com/researchdocumentcontentpage.aspx?docid=PBC_1155649