Please find below our portfolio management team’s Summer 2019 Municipal Market Review.

This provides an overview of current market conditions and information about our total return and goals-based strategies.  If you would like additional information about our process or specific strategies, please let us know.

Bernardi – Market Review – Summer 2019

Registered investment advisors (RIA) who purchase fixed income securities for clients, should have best execution in the forefront of their minds.

In July 2018, the SEC Office of Compliance Inspections and Examinations (OCIE) issued a risk alert detailing a list of deficiencies seen in various RIA best execution policies and procedures.  Additionally, the SEC watchdog, FINRA, included best execution in its 2019 examination priorities.

These recent regulatory notices and the impending “Regulation Best Interest” rule strongly indicate regulatory scrutiny regarding best execution is here to stay.

Authenticating best execution is a tedious and cumbersome process, especially in the fixed income market, where there are thousands of different issuers and bond structures.  In the municipal bond market alone, there are over 50,000 issuing authorities.

Utilizing the proper execution platform is another important consideration.  Simply purchasing(selling) bonds from(to) an advisor’s custodial platform may prove to be insufficient from a best execution standpoint and begs the question, “Has the bond market been adequately shopped?”  It is up to the advisor to ensure their clients have wide market access and to satisfy their best execution responsibilities.

For these reasons many advisors look to Bernardi for help with best execution within the fixed income markets.  We offer different platforms based on the advisor’s needs.  Those looking to:

  • outsource fixed income investing:  utilize fee-based Bernardi Asset Management (BAM).
  • manage their fixed income in-house:  utilize Bernardi Securities’ (BSI) trading desk for primary market access, additional secondary market access, and other resources.

Bernardi’s best execution procedures are intricate.  Bond pricing is analyzed across similar state, coupon, rating, and issue structures.  Past trading prices, current offerings prices, and new issue levels are compared by experts focused only on the fixed income market.  Markets are viewed across execution platforms including:  Bloomberg, alternative trading systems (ATS), brokers-brokers, broker-dealers, and BSI’s trading desk.  The process is extensive and exhaustive, but it is necessary.

The burdens of best execution are real, and they take time away from advisors’ day-to-day role of helping their clients with their broader financial plans.  Bernardi’s experience and role as an expert in fixed income markets is utilized by advisors to help ease some of the best execution burdens.

Please give us a call to learn how Bernardi can help you meet your best execution responsibilities and build customized fixed income portfolios for you and your clients.

A FOUNDATIONAL PILLAR: INVESTOR FAITH AND TRUST

The municipal bond market provides our economy with a deep pool of investment capital.  Simply stated, Municipal Bonds Build America.

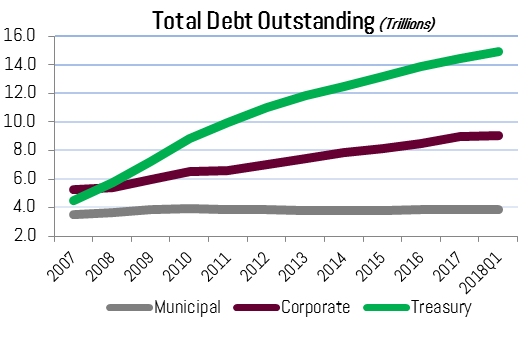
Investor participation is high as both individual and institutional investors commit their savings to build our nation’s infrastructure: schools, town halls, county courthouses, airports, water and sewer treatment plants, recreation facilities, hospitals, and electric utilities to name a few projects.

It is most often a long-term commitment, an important factor contributing to the deep, dynamic, and liquid municipal bond market.

Importantly, investor faith and trust in the market is a foundational pillar on which the health and dynamism of the market relies. It’s incumbent on industry professionals to strengthen and safeguard this pillar.


What is Regulation Best Interest?

Currently, a major initiative of the Securities and Exchange Commission (SEC) is “Regulation Best Interest” or “Reg BI”.  The final version of the rule is expected in the latter half of 2019. The proposed regulation focuses on the conduct standards of industry professionals in their interactions with investors.  We have written about this issue over the years in our “Market Insights” (September 2015 and May 2016).

We support the Commission’s initiative on this important issue. It strengthens conduct standards for broker-dealers and investment advisers, while simultaneously preserving investor choice and access to a variety of advice and service models.

It is a complicated subject and it will be difficult for the Commission to craft a solution to placate the differing viewpoints.  King Solomon would have a difficult time figuring this one out.  But the current proposal is a significant improvement to the status quo. “Progress not perfection” is an appropriate approach and amending the rule in the future is always possible.

In this writing we discuss key issues surrounding the SEC’s proposal.  Importantly, the proposed rule allows for investor choice and avoids forcing a “one size fits all” solution on investors, advisers and broker-dealers. We also describe what Bernardi Securities is already doing to address this important issue.

Recently the RAND Corporation conducted a survey on behalf of the SEC. It queried more than 1,800 individuals.  Not surprisingly, the results show investors seek information about the investment fees they are charged and the types of conflicts of interest their advisers and brokers may have in their dealings with them.  The survey included a “Customer Relationship Summary” (CRS). Under the proposed rule, registered investment advisers and broker-dealers serving retail customers would be required to deliver the CRS to investors.

The RAND survey, along with others, have found many investors are confused whether they are dealing with a broker-dealer or an investment adviser. Investors should understand these differences since there are important distinctions how the two groups interact with them and each have different mandated requirements and market access. For example, the study showed many respondents did not understand the meaning of the term “fiduciary.”

It’s incumbent on industry professionals and their firms to clearly define roles and avoid confusing the issue with a plethora of titles and unclear marketing.


What’s the Difference Between a Broker-Dealer and a Registered Investment Adviser?

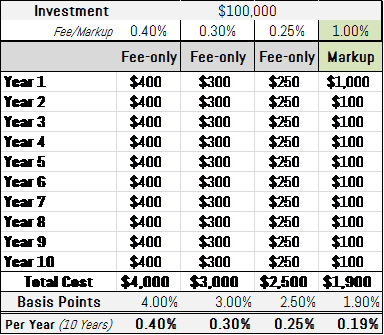
As noted above, cost is one of the most important factors for individual investors when deciding on a manager. Investor misunderstanding regarding how a professional is compensated likely increases the possibility expectations will not be met and it may end up costing them more too.

Typically, registered investment advisers charge clients an ongoing fee (fee-based) calculated as a percentage of assets under management.  Normally, their clients also pay additional brokerage fees and mark-ups for trades the adviser executes in their accounts. The adviser monitors the account and, in most cases, understands the broader financial goals and helps plan accordingly.

Broker-dealers charge clients for each transaction they recommend and execute (activity-based). Investor cost is fundamentally transactional based, a “pay-as-you-go approach”. The broker may or may not monitor the account over time: this depends on the extensiveness of the platform of services offered.

Under current law a different legal standard applies to how an adviser and a broker-dealer interact with clients.

A registered investment advisory firm and its registered personnel are subject to SEC regulations and are subject to a fiduciary duty. This is the highest standard and generally means any advice offered must be in the client’s best interest and is subject to a duty of care and loyalty. The advisor must fully disclose any material conflicts of interest and must obtain the client’s informed consent of any conflicts the advisor or company have.

It is important to remember conflicts exist in any successful enterprise.  An advisor’s duty of loyalty does not prohibit conflicts but does require disclosure and client consent when material conflicts exist.

A broker-dealer and its personnel are subject to a regulatory regime overseen by several agencies including: the SEC, Financial Industry Regulatory Authority (FINRA) and the Municipal Securities Rulemaking Board (MSRB). Thousands of regulations mandate professional standards for a broker -dealer.  As examples, a broker-dealer is required to adhere to FINRA Rule 2111 (Suitability Rule), FINRA Rule 5310 (Best Execution) and FINRA Rule 2121 (Fair Pricing and Commissions) when interacting with clients. A broker-dealer and its personnel are not subject to the fiduciary standard.

Neither the fiduciary or suitability standards prohibit recommending a principal transaction or one that will result in a more lucrative transaction for the firm.  Importantly, the governing SEC, FINRA, and MSRB regulations require the standards of “Suitability “and “Best Execution” be satisfied regardless of the investment source and its bottom-line result for the firm. 

Broker-dealers and their registered employees are subject to capital requirements, licensing, registration and continuing education requirements. Broker-dealers are required to maintain a certain amount of net capital (Exchange Act 15c3-1) and carry a Fidelity Bond.

Advisory firms do not have either such requirement, although many do carry Errors and Omission insurance policies.

FINRA generally examines its broker-dealer members no less than every 2-3 years. Historically, the SEC examines registered investment advisers less frequently.

As a practical matter, broker-dealers are subject to considerably more regulatory oversight and generally have more available resources if a problem occurs.


What is Bernardi’s Approach?

We recognized the issue of today’s discussion years ago and formed Bernardi Asset Management (BAM). BAM is a SEC Registered Investment Adviser and is a wholly owned subsidiary of parent company Bernardi Securities (BSI).  We are a dually-registered firm: we provide investors with options to access our bond market expertise.

We offer these bond portfolio management alternatives:

  • Fiduciary, fee-only portfolio management under the BAM platform
  • Transactional, mark-up/down management under the BSI platform

Our internal policies and procedures for both platforms embody these three principles:

  1. provide investment advice and recommendations we believe are in the best interests of investors
  2. charge fair and reasonable compensation
  3. avoid making misleading statements pertaining to fees, compensation, recommendations or existing material conflicts of interest

These principles along with our internal procedures guide and direct our management team. Under both options our clients have access to a multi-step, fair and transparent portfolio management platform.

Over the years we have learned several things from our clients:

  • Investors want management choices based on their needs and market knowledge
  • Most appreciate having a choice as to how they engage us
  • Investors appreciate our transparency, our clarity, and understand the differences between the two platforms

At Bernardi we operate and design our policies and procedures with an overarching goal to align our interests as best we can with our clients.

We recognize:

  • Conflicts are endemic to any successful enterprise: both advisers and broker-dealers confront them
  • There is nothing inherently wrong with conflicts
  • The result is often a good outcome

Specifically, there is nothing inherently wrong with a broker-dealer or adviser acting in a “principal” capacity. Years ago, the SEC wrote interpretive guidance on this topic (SEC “Interpretation of Section 206(3) of the Investment Advisers Act of 1940”, SEC release No. IA – 1732).

Similarly, there is nothing inherently wrong with a fiduciary, fee-only adviser sourcing all of its clients’ bond purchases from its custodian – provided the adviser adheres to its fiduciary and best execution responsibilities.

Trust and transparency are the foremost principles of a healthy client relationship: it is as simple as that. This is fundamental to the way we operate our firm.

Investors should ask many questions of their financial professionals and not simply rely on a “fiduciary” or “best interest” moniker.

Regardless of the final form of Regulation Best Interest we will continue to serve our clients faithfully.  We have adjusted our business model many times over the years to better serve our clients. An innovative spirit abounds at Bernardi so we will continue to do our part to improve how we conduct our business interactions.

We appreciate any constructive feedback and commentary. Thank you for your continued confidence in our team.


Sincerely,

Ronald P. Bernardi
President & CEO

April 11, 2019

January 18, 2019

By: Matthew P. Bernardi

There are many facets and varieties of our active management approach to municipal bond portfolios. Credit analysis, ladder positioning, strategies offered, and tax-loss harvesting to name a few. Another important aspect of active management is the allocation to (and avoidance of) specific geographies relative to the benchmark. Considering the pitfalls of bond benchmark construction, tax reform, state-by-state tax regimes and credit trends, we believe geographical positioning plays a crucial role in providing investors higher levels of income relative to passive securities (index funds).


“Inherently faulty benchmark construction may be the fire boiling the passive pot of bond investors (frogs) over time. “


Unlike stock benchmarks, bond benchmarks are often misaligned with the average municipal bond investor’s investment profile. Company stocks within the major equity benchmarks – such as the S&P 500 – are weighted based on market cap.[1] The market cap of a stock is determined by the historical success (or lack of) of a company. Therefore, the most successful companies such as Microsoft, Apple, Amazon, and Google (2 share classes) are the largest components of the S&P 500. So, when you buy the SPDR S&P 500 ETF (ticker: SPY) – which is passively indexed to the S&P 500 – you are automatically allocated in such a way to today’s largest and most successful companies (though this does not necessarily mean tomorrow’s). Bond benchmarks work much differently.

Unlike the stock market where the index is dedicated to the winners, municipal bond indexes are allocated to the largest issuers of debt. Often, higher debt issuance is inversely related to credit health. Additionally, the bulk of the largest issuers have tax regimes that make it unappealing for out-of-state investors to own their bonds (high state income tax rates + double tax-exempt bonds).

The Barclays 7-year municipal benchmark and top state allocations are as follows:

State %
CA 15.76%
NY 15.60%
TX 9.10%
IL 4.95%
FL 4.28%

Source: Bloomberg

Concurrently, Vanguard’s passive Tax-Exempt Bond ETF (Ticker: VTEB) is similarly invested:

State %
NY 20.00%
CA 14.00%
TX 10.80%
NJ 5.00%
IL 4.90%

Source: Vanguard

From an income perspective, if you are a resident of a state with no or a low state income tax rate (i.e., Florida, Texas, Illinois, etc.), there are ample reasons to avoid investing a significant percentage of your portfolio in high state tax issuers like New York and California – which offer double, sometimes triple, tax-exemption to investors residing within those states. These two states alone, make up over 31% of the benchmark and 34% of VTEB. These tax regimes, paired with the recent tax reform and the need for tax-exempt income, cause the average NY or CA bond to trade at yields very close to the benchmark. See the “Sprd” (spread) column in blue below, which notes the difference in yield between the given state’s 10-year bond and the AAA-rated Bloomberg benchmark tax-exempt yield. You will notice that the State of New York trades 9.1 basis points (0.091%) below the benchmark.

A non-NY resident does not benefit from double tax-exempt New York bonds and, therefore, should largely avoid them and the benchmark. There are plenty of opportunities for higher tax-exempt yields elsewhere.

However, when one passively invests (such as in VTEB or the MUB iShares ETF) in the municipal market you are in fact often allocating funds to larger, lower yielding issuers. Bernardi’s active Separately Managed Account (SMA) approach not only aims to avoid these overvalued states (for out of state residents), but aims to allocate to undervalued geographies, as well.


Don’t Be the Proverbial Frog

The dangers of bond benchmark construction and passive investing may become apparent in the coming decades as it pertains to U.S. Treasuries. The U.S. government’s projected budget deficit is expected to widen from fiscal-year 2018’s 3.8% of GDP to 4.6% in 2019.[2] This means more debt issuance is needed to fund the deficits, and this is paired with a Federal Reserve offloading its Treasury holdings by $30 billion per month (plus $20 billion in mortgage backed securities). How the market will digest the additional debt is one of the most prominent questions for current bond investors. As the Treasury floods the market with issuance, it will not only crowd-out other forms of debt, but it also means a larger percentage of passive investment vehicles will be allocated to Treasury bonds.

This situation has two major implications for investors. First, because passive benchmarks continue to grow in popularity and will be robotically buying more Treasuries, this dynamic may lessen the impact of “runaway deficits” and resulting spiking yields forecasted by contemporary bond vigilantes.

Secondly, investors may be exposed to an unattractive allocation of bonds as they’ll be forced to own a greater percentage of Treasury bonds simply because the Treasury is issuing more debt. Unless the federal government can attain a more stable fiscal path, it is not implausible for it to lose the coveted Aaa rating by Moody’s. S&P rates the credit AA+ after downgrading in 2011 during the debt ceiling crisis. If the U.S. government’s credit trend continues to regress, inherently faulty benchmark construction may be the fire boiling the passive pot of bond investors (frogs) over time.


***************

[1] Side note: This is why the Dow isn’t the greatest indicator of market moves as the index is weighted based on the nominal price of the stock, not market cap. For example, 3M has almost double the weighting of Microsoft simply because the stock trades at $194 per share vs. $107 for Microsoft. Microsoft is a much larger company, however, with a market cap of just under $825 billion vs. $113 billion for 3M.

[2] Moody’s Weekly Market Outlook, December 20th, 2018. https://www.moodys.com/researchdocumentcontentpage.aspx?docid=PBC_1155649

We wish everyone a happy New Year.

October 1st marked the first day of our 35th year at Bernardi Securities. 

In the fall of 1984 my father, Ed Bernardi, and several others opened the doors of Bernardi Securities for the first time. Our office was located across the street from City Hall at 134 North LaSalle where Mayor Harold Washington presided. My mother served as our telephone receptionist for the first few weeks, while my newlywed wife offered whatever support was required. We began our adventure with great expectations, irrepressible enthusiasm, and seemingly boundless energy. We worked literally elbow to elbow in a one room office that was no more than 1000 square feet.  We sourced bonds from numerous places including the daily “The Blue List” publication, the J.J. Kenney wire, and a handful of bond firms and muni departments that prevailed at the time. Our initial capital base was $275,000.00. We relied on it and the good graces of our banking partners at American National Bank and Trust Company to fund the firm’s inventory. 

Our investor clients were numerous, loyal, and faithfully supportive from the outset.  We were fortunate to have that advantage. And, thankfully, this dynamic continues to this day. For this we are forever grateful and no written or spoken words can begin to convey the gratitude we have in our hearts.

For more than three decades, dozens of honest, diligent, smart and hardworking employees helped the organization flourish. A few remain from the earliest days continuing to meaningfully contribute to our present efforts. Our group was most often eclectic and diverse in nature. But a collective belief and commitment to our vision superseded the differences, allowing us to deliver to our clients what they sought and needed.

Chairman Ed Bernardi is our founder, leader, and mentor. The idea of forming Bernardi Securities belongs to him. He led and taught us for years. He urged us to remember our principles, believe in ourselves, work hard and treat people fairly. He taught us to self-trust as well as the lessons about running a business. He taught us the innumerable lessons we needed to learn in order to help our clients prosper. The sum of his teachings brought our organization to the place we find ourselves today.  

We have been extremely fortunate over the last thirty-four years and have survived numerous setbacks and threats along the way: the Savings and Loan crisis of 1980’s, Black Monday Stock Market Crash (1987), Junk Bond market crash (1989), Bond Market crash (1994), Asian Contagion (1997-98), Dotcom bubble burst (1999-2000), Global financial crisis (2007-08) and more recently the bankruptcies of Detroit and Puerto Rico.

For many of our colleagues and their firms, these events proved to be existential ones and some firms were unable to successfully navigate the situation at hand. The financial service industry landscape today is unrecognizable when compared to when we started, and the make-up of market participants has changed greatly. 

We are equally humbled and proud by our present-day reality and we thank our investor and issuer clients, our strategic partners and many, many friends for helping us along the way. We know our success is not possible without your continued confidence in our team.

We realize you count on us and we strive mightily not to disappoint as we look excitedly at the year ahead.

I wish everyone a healthy, happy and prosperous 2019.  Thank you.


Ronald P. Bernardi

President & CEO
Bernardi Securities, Inc.
January 3, 2019


Below please find the our portfolio management team’s Fall 2018 Municipal Market Review.

This provides an overview of current market conditions and information about our total return and goals-based strategies.  If you would like additional information about our process or specific strategies, please let us know.

2018 Fall – Bernardi Municipal Market Review

October 10, 2018

By Matthew P. Bernardi

The U.S. economy is firing on all cylinders right now. Small business confidence has reached all-time highs, jobless claims are near 49 year lows, while household net worth continues to climb into record territory. Federal Reserve Bank of New York President, John Williams, recently noted the economy is “about as good as it gets.” This growth spurt appears in what is now the second longest expansion cycle in history (111 months). Importantly, today’s growth is paired with stable inflation, which keeps the Fed’s dual mandate in check and enables a patient path of rate hikes in the near future. When will the rate hikes end and what will be the resulting shape of the yield curve? These are two pressing questions for market participants…and even the Fed itself. That said, based on history, the current shape of the yield curve indicates a recession is still years away.

Barring an inflation surge or sustainable GDP prints above 3.00%, the Fed Funds Rate (FFR) is awfully close (currently 2.00-2.25%) to the Federal Reserve Board’s long term projection of 3.00%. Assuming this cycle’s trends continue (GDP growth has averaged 2.20% since 2010) and ongoing 0.25% rate hikes, the drift to a flatter yield curve will continue (i.e. the difference between short term and long term rates moves lower).

Source: Bloomberg

The difference in yield between the 2-year Treasury and 10-year has moved from 1.36% in late December 2016, to a mere 0.33% today. At this low of a spread level and with history as a guide, this signals tightening financial conditions and a higher potential for recession.

In fact, over the past 40 years, every recession has been preceded by an inversion of the yield curve (when long term rates are lower than short term rates). We are not at this point yet, but current yield curve dynamics and the trend worries some market participants. Therefore, it is not surprising that calls for a looming recession have grown louder in recent months.

The reason for the correlation between recessions and the steepness of the yield curve rests somewhere between the curve being both a source and a signal of the oncoming recession. As a source, a flatter curve reduces bank profitability and the willingness to lend. Banks often borrow at short term rates and lend at longer term yields. As profitability diminishes so does their inclination to lend, therefore, reducing economic growth potential of certain elements in our debt-reliant economy as loan availability for small business financing, car loans, and mortgages is reduced. The process of debt-fueled growth, therefore, is slowed leading to declining asset values, incomes, and overall growth. As a signal, the flatter yield curve demonstrates a central bank more concerned about price pressures (inflation) than the near term growth trend. Think the late 1970s to 1980s Volcker-lead Fed, which sacrificed near-term growth in order to tame inflation by significantly increasing short term rates.

Is this time different?

The current shape of the yield curve and past trends point to a recession that may be years away. As the graph below shows, the yield curve typically inverts years before a recession sets in. The past five recessions have all followed this trend. For example, as the Greenspan-led Fed began hiking rates in the summer of 2004, the difference between the 2-year and 10-year treasury went negative/inverted (i.e. the 2-year yield was higher than the 10-year yield) in December of 2005, while the recession began in the beginning of 2008, 2 years after the inversion first occurred.

Source: Bloomberg

The ultimate monetary policy tightrope walk occurred in the 1990s, which supported the longest expansion on record, 120 months. In early 1994 the Fed tightened the FFR by 300 basis points (from 3.00% to 6.00%), which is the same goal as today’s Fed in terms of rate of change (though from 0% to 3.00%). This caused a flattening of the 2yr/10yr curve from 1.60% at the commencement of the tightening to 0.08% at the end of 1994. The curve then steepened to 0.87% as the Fed reduced short term rates, before meandering its way to an inverted curve in 2000 as the Fed began another hiking cycle. The Fed actually hiked three times after the curve inverted to 5.75%, 6.00% and finally to 6.50% on May 16, 2000. Eventually the tech bubble popped and a recession hit in spring of 2001. Perhaps Fed Chair Jerome Powell is aiming to mirror the Greenspan-led fed of the 1990s and break the 120-month growth record.


Source: Bloomberg

Past trends certainly provide insight about the future, though as Mark Twain once said, “History doesn’t repeat itself, but it often rhymes.” This is no less true today due to the classic tightening cycle paired with an unprecedented level of global central bank easing and balance sheet growth. Though the Fed is the world’s most powerful central bank for the world’s biggest economy, the central banks of Japan, Europe, and China remain in easing mode and cumulatively hold multiples of financial assets compared to the Fed. This means that our rates are intertwined with German Bunds (10-year yield at 0.55%) to Japanese Government Bonds (10-year yield 0.14%).

Because history does not perfectly repeat, no one should take for granted that a positive sloping yield curve means no imminent recession. Central banks had never reached the “zero-bound” (zero to negative short term rates) since the Great Depression. Therefore, higher rates, even with a somewhat normal sloping yield curve, may cause enough financial stress to cause a recession. We may not truly understand how reliant the global economy is on the zero-bound. This would be the first recession in 40-years NOT preceded by an inverted curve. Alternatively, if today’s recent growth spurt of 4%+ GDP is sustainable on a medium term basis and global growth follows en suite, we would expect gradual steepening of the curve leading to higher long term rates relative to short term rates…further extending the growth cycle well past the 120 month record set in the 1990s. We actually have experienced this dynamic over the past month following somewhat hawkish Fed-speak and continued strong economic numbers.

Today is certainly a long and thin tightrope for Jerome Powell and the Federal Reserve Board to walk – while the path forward is hazy at best. Based on historical trends, a recession is still years away, though the unprecedented nature of central bank intervention may have transformed traditional correlations.

July 5, 2018
By Matthew P. Bernardi

 “[Avoid] likewise the accumulation of debt”. – George Washington

Since the financial crisis, municipal bonded debt outstanding has increased at a snail’s pace of 0.51% per year.[1] With corporate debt growing at an annual pace of 5.33% and Treasuries at 10.18%, it appears the average municipal government has demonstrated relative fiscal restraint. In the 7 years leading up to the 2008-2009 financial crisis, municipal debt grew at an average annual pace of 7.95% vs. corporate of 6.45% and 6.34% for the Treasury.[2] What accounts for this tamed post-crisis growth trend? Is it truly fiscal prudence, or can we attribute the slow growth to other market dynamics?

The post-crisis boom in corporate and treasury issuance is due to variety of factors. Corporate America has aggressively taken advantage of low rates induced by the Fed. Along with increased profitability and tax reform, higher debt issuance has allowed S&P 500 companies to massively increase dividends and stock buybacks. As an example, Walgreens Boots Alliance has increased long and short term debt from $2.5 billion in January of 2009 to over $15 billion today.[3] On June 28th, the company announced a $10 billion stock buyback, paired with a 10% increase to their dividend.

Source: SIFMA

Our national debt has also skyrocketed. Treasury debt held by the public grew to $7.2 trillion from $5.7 trillion – or 25% – from 2008 to 2009. This pace of growth has far exceeded GDP growth and now amounts to a total of just under $15 trillion.[4]

In recent years, municipal issuers have not tapped the market nearly aggressively in what appears to be an effort of fiscal restraint. For bondholders, it should be comforting to see low growth rates of indebtedness during a mild economic growth cycle. However, the pace of growth appears abnormally low and we believe there are more forces at play keeping public issuance subdued.

Weights on municipal debt issuance

Though debt liabilities for issuers appear under control, unfunded pension liabilities have increased at a greater pace since the crisis. In fact, in an effort to increase accounting transparency, GASB implemented Statement No. 68 in 2014. This requires state and local governments with defined benefit plans to report their net pension liability on the balance sheet. This enhanced standard certainly helps the credit analysis process: we consider debt + unfunded pension liabilities per capita as an important credit metric for vetting issuers which have both i) high unfunded liabilities and ii) limited statutory reform flexibility.

Unlike bonded debt outstanding, unfunded pension liabilities are complicated projections based on a multitude of assumptions over multiple decades. The crisis and resulting stock market swoon put a dent in the asset side of the pension liability calculation, therefore, issuers have been forced to allocate incremental dollars to pension servicing rather than debt servicing, leading to lower total issuance.  Future liabilities cannot be measured purely by quantitative means, especially due to the occurrence and potential for pension reform. Though pension reform has taken hold in various parts of the country, its impact will take years, if not decades, to play out. In the meantime, pension funding ratios will remain historically low, therefore, required contributions high. The higher than average contributions will continue to crowd out other forms of spending, such as debt servicing.

Looking further under the hood, a second reason for subdued public issuance is the growth of the bank loan market. In 2014 S&P estimated that direct loans could account for as high as 20% of municipal issuance.[5] Increased direct loans as a percent of the municipal issuance likely has been a reaction to a higher regulatory burden on issuers and more stringent capital rules placed on banks under Dodd-Frank. In our opinion 20% seems high, but we will use it for the analysis below.

Source: Federal Reserve Bank of St. Louis

Assuming S&P’s 20% figure, this would equate to an additional $789 billion in municipal debt issued since the crisis (but instead held directly by banks as a loan rather than a security). That would mean the market grew to $4.63 trillion from $3.65 trillion in 2008. Or a growth of 2.66% per year vs. the 0.51% increase per year noted in the introduction. Much higher, but still lower than the previous growth cycle and still paltry compared to corporations and the Treasury. [6]

Will the low issuance trend persist?

Looking forward, a combination of bank regulatory reform, characterization of municipal securities as 2B HQLA assets, enhanced requirements for Rule G-34, continued economic growth, and tax reform should all serve as tailwinds for public market debt issuance. That said, 2018 will be an abnormal year due to the elimination of the advanced refunding capability. New money issuance, on the other hand, is projected to be at its highest level since 2010, which was the culmination of the Build American Bond program. New money issuance is still well below pre-crisis levels, but up 19.2% year-over year through May.

****

In summary, taking into account the growth of unfunded pension liabilities and the private debt market, the low rate of municipal public debt issuance makes more sense, but does not entirely explain the drop-off. Fiscal prudence on the part of state and local officials could make up the balance and is certainly a credit positive for the municipal bond market, both in of itself and relative to other high-grade fixed income asset classes.


—————————-

[1] 2008-Q12018, SIFMA US Bond Market Issuance and Outstanding https://www.sifma.org/resources/research/us-bond-market-issuance-and-outstanding/

[2] Average municipal growth figure excludes 51.3% growth rate from 2003 to 2004 following the Federal Reserve’s revision of prior undercounted figures.

[3] Source: Bloomberg

[4] Source: SIFMA Outstanding U.S. Bond Market Debt

[5] Alternative Financing: Disclosure Is Critical To Credit Analysis In Public Finance, Standard & Poor’s Ratings Services. February 18th, 2014.

[6] Source: Federal Reserve Bank of St. Louis

Below please find the our portfolio management team’s Spring 2018 Municipal Market Review.

This provides an overview of current market conditions and information about our total return and goals-based strategies.  If you would like additional information about our process or specific strategies, please let us know.

2018 Spring – Bernardi Market Review

There are two possible ways an investor pays to access the municipal bond market and portfolio management services for a separately managed account:

  1. One-time transaction cost model (markup/down)
  2. Annual fee model

As a hybrid-firm (broker-dealer & registered investment advisor), Bernardi Securities (BSI) offers a choice of fee-only and one-time transaction platforms to our portfolio management clients. Properly selecting one over the other depends on the interest, needs, and strategy of the given portfolio.

On May 14th, 2018 the “markup rule” (amendments to rules MSRB G-15, G-30 and FINRA 2232) become effective requiring broker-dealers (BSI) to disclose markups/downs to retail investors for same day secondary market transactions.

We believe the amended rules are good for individuals and will serve to heighten industry transparency. At Bernardi, we have always prided ourselves on the transparency we offer regarding portfolio construction and management costs. In fact, we enable greater cost transparency compared to the rule.  For many years we have made available to our portfolio managed investor clients and their investment counselors the total markups/down for each account on investments that occur throughout the year– not just on same day trades.

We began providing transparency years ago because cost metrics are an essential factor in helping you determine the appropriate municipal bond investment strategy and effectiveness of a manager. Additionally, we wanted to be at the vanguard of our industry.

Below is a hypothetical cost analysis of a similarly sized and structured markup portfolio and an annual fee portfolio model. This should help you compare which cost platform (transaction-based or fee-based) is most attractive based on your municipal bond strategy for a separately managed bond portfolio (SMA).

*****

Fee-only Cost Inputs:

A popular version of the Bernardi Asset Management SMA platform charges an annual fee between 25-40 basis points (and a lesser fee for large portfolios) for bond portfolio management. In these scenarios an investor pays 250-400 basis points over the course of 10 years. Over ten years, for every $100,000 investment in the portfolio, the fee will be a cumulative $2,500-$4,000.

Mark-up Cost Inputs:

Compare this now to the transaction based platform cost model where each bond investment or sale is assessed with a one-time markup/markdown. Our example assumes all bonds are held to maturity. Markups vary and can differ based off of bond type, maturity, block size, market dynamics at time of trade and other factors. For this analysis we will assume a 1.00% mark-up.

Cost Overview:

Assuming a fee range of 0.25%-0.40% and a one-time markup of 1.00%, the markup option is more attractive for a 10-year laddered portfolio that experiences 10% turnover each year.


Portfolios with lower turnover and/or shorter maturities typically experience lower average markups, as well.

Take for instance an income oriented portfolio with an average 15 year maturity. Assuming markups amount to 1.25%, this averages to an annual implementation cost of only 8 basis points (0.08%) on principal invested. This does not include reinvested coupon interest, unless taken.


In Conclusion:

From a cost perspective, there is not one right answer for investors. And the above analysis should be one of many aspects of your due diligence approach to the municipal bond market.

As municipal bond specialists we are here to help you navigate the market.

Please call your Bernardi Investment Specialist or Portfolio Manager if you have any questions or would like to discuss each platform model in detail.


Sincerely,

Bernardi Securities, Inc.

May 14, 2018