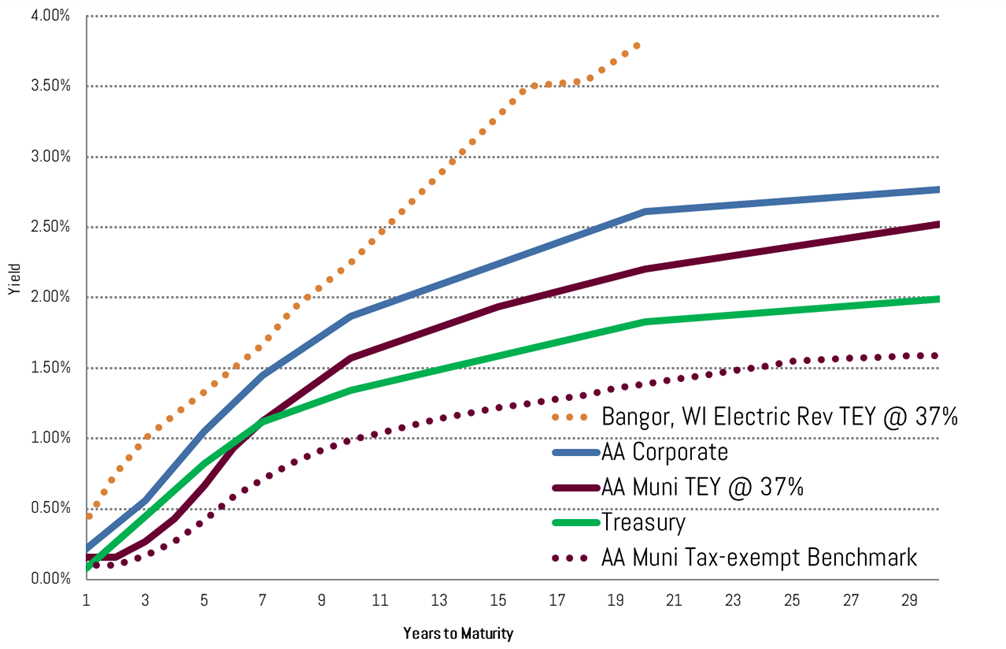
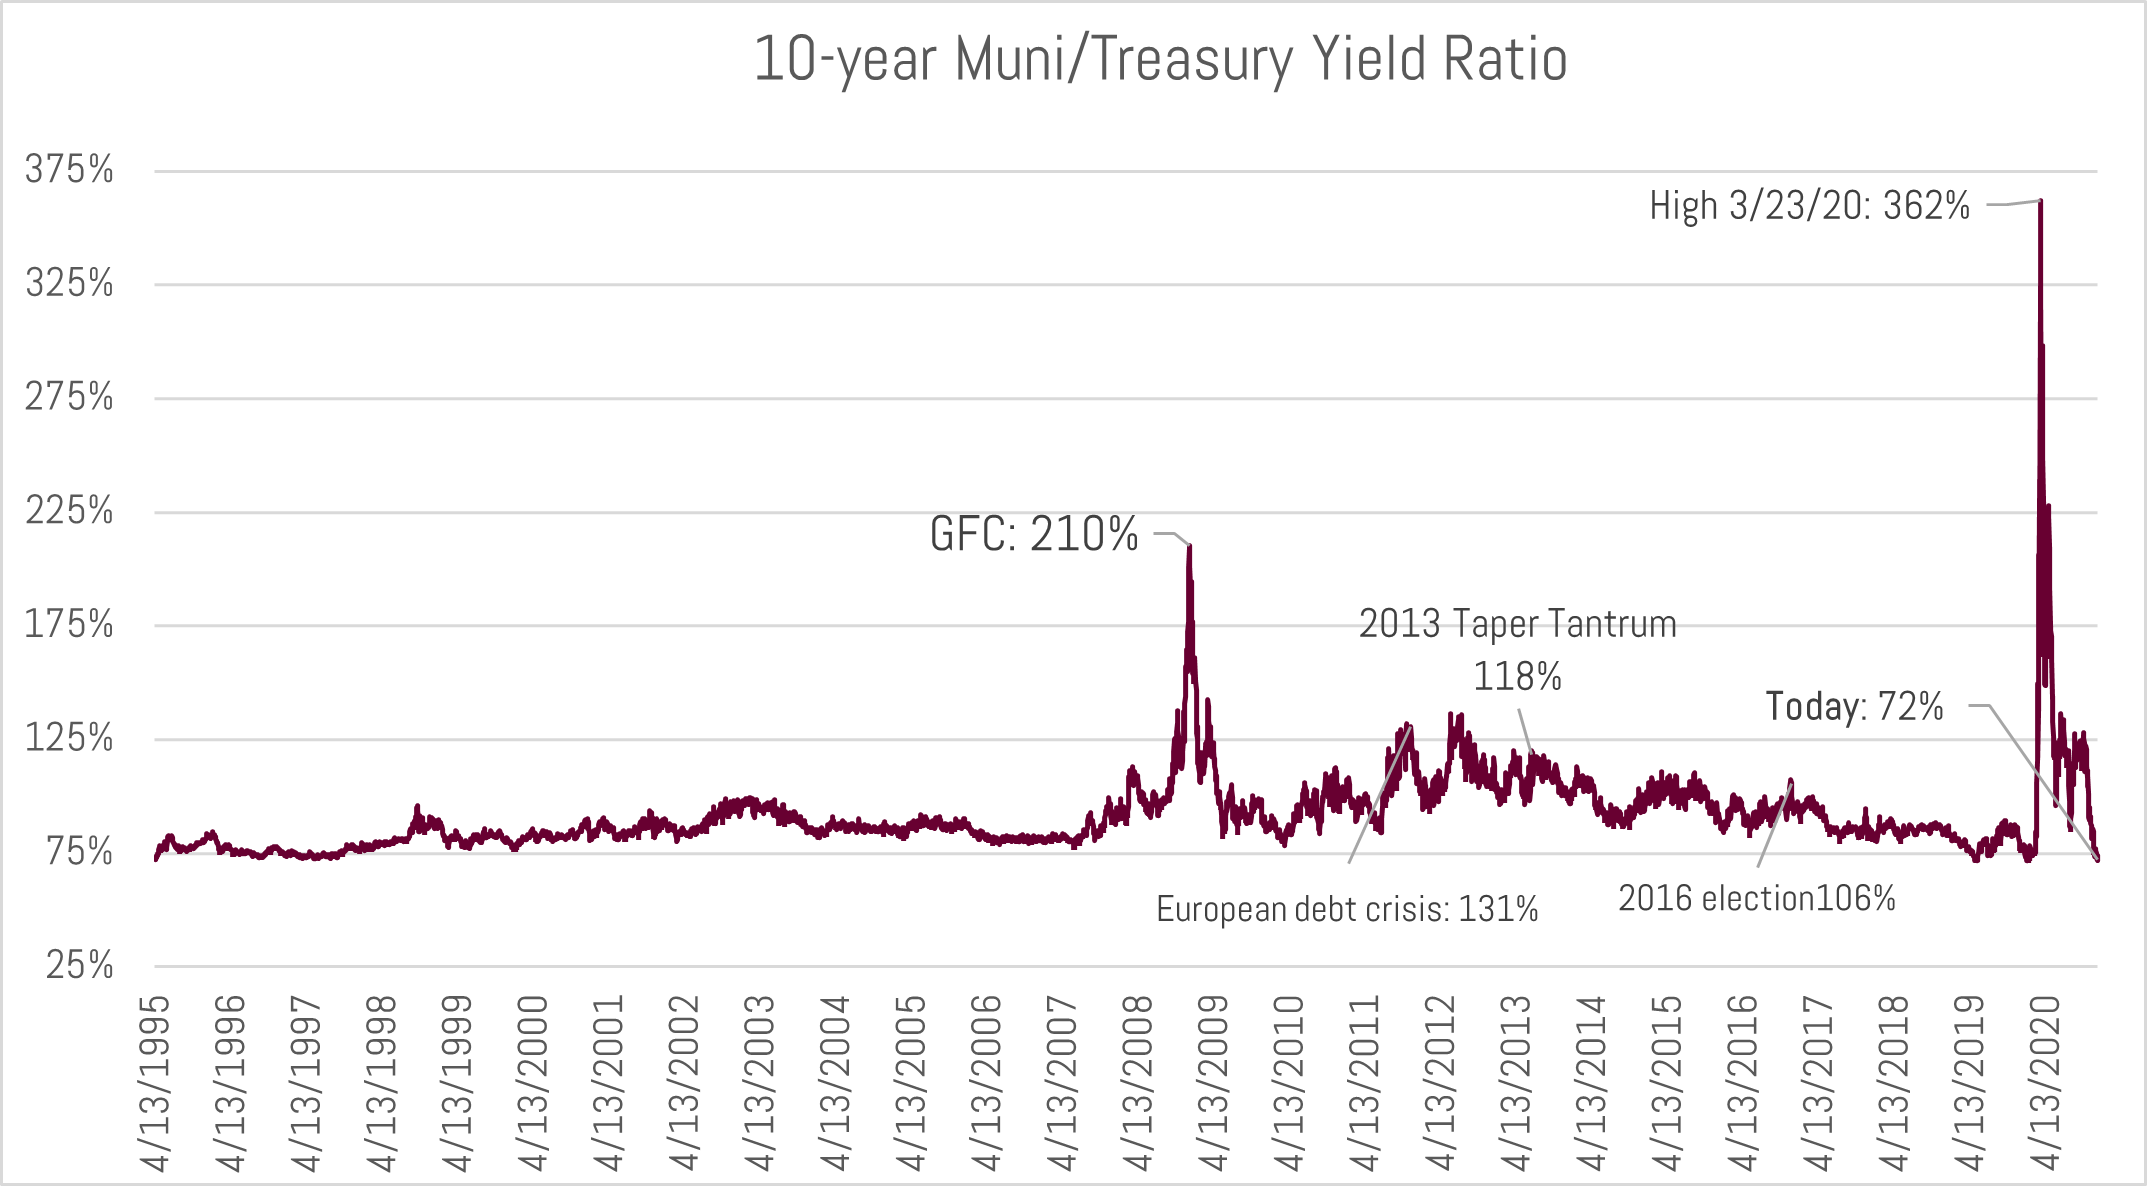
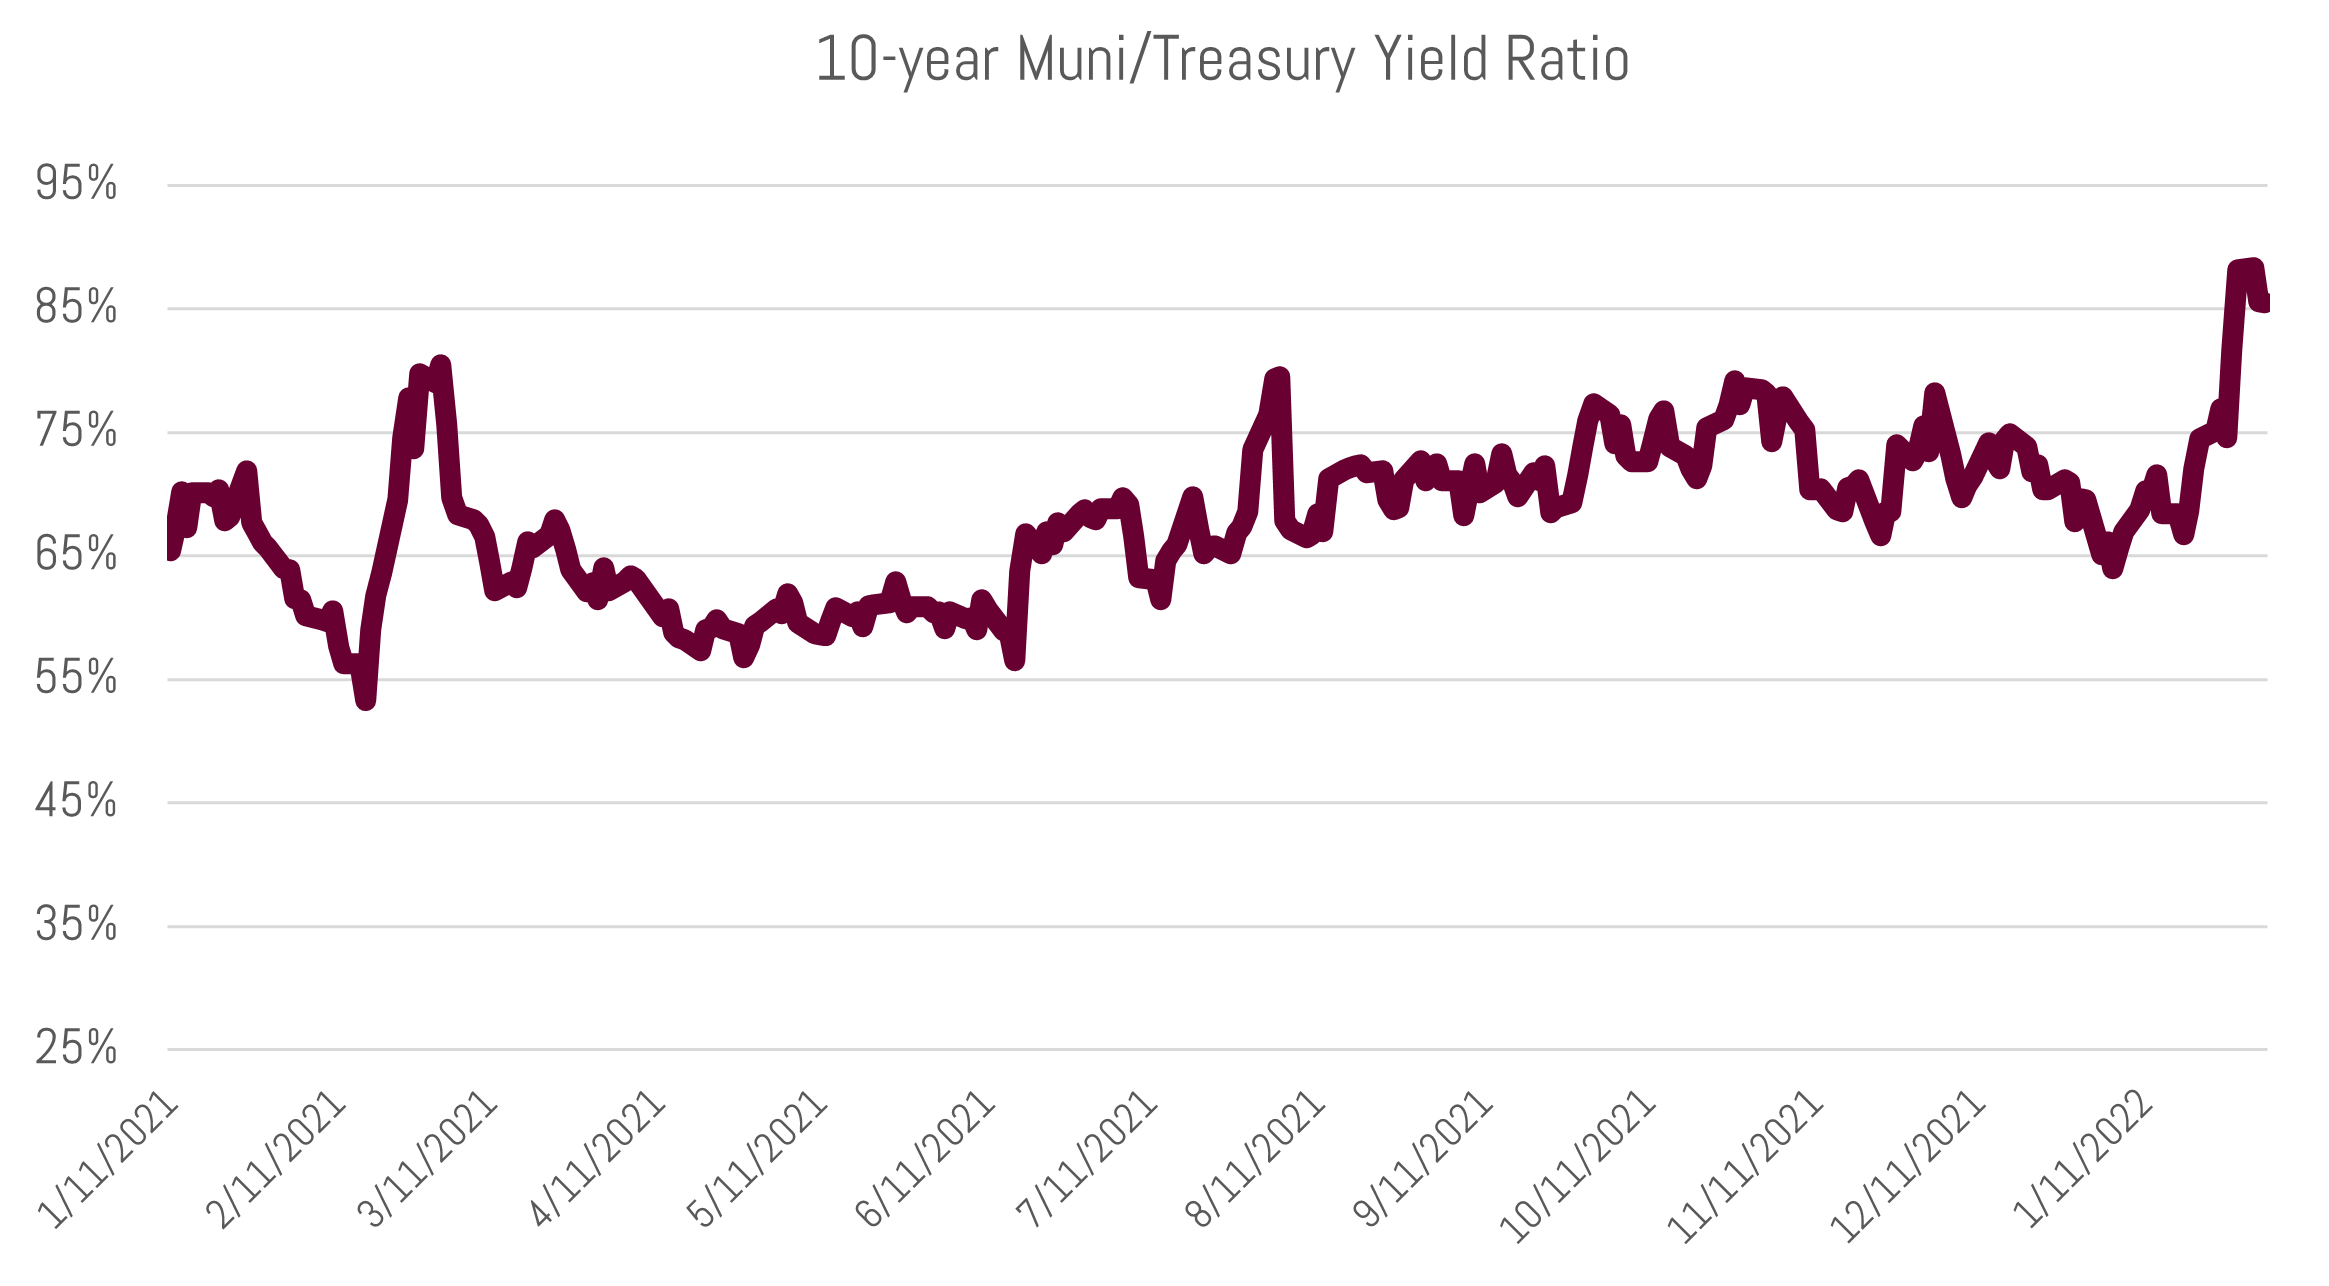
2022 is off to a volatile start in global financial markets as the Fed begins the process of tightening monetary policy. Yields have risen – especially at the front end of the yield curve, thereby flattening the curve. Today the average AA rated 2-year and 10-year municipal bond yields 0.97% (1.53% TEY) and 1.66% (2.63% TEY)1, respectively. This is up from 0.26% and 1.18% at the start of the year. The 10-year muni is now at the same level it was on January 1st, 20202, prior to the COVID outbreak. Yield ratios (municipal yields as a percent of treasuries) have moved higher as muni bond mutual funds recently experienced the largest weekly outflow ($1.4 billion) since April 2020.3 The 10-year AAA muni is currently at a ratio of 85%, which is up from 67% on Thanksgiving and now back to historical averages. As we noted in End of Easy and its Implications for the Municipal Bond Market, higher levels of volatility can be expected as the elephant (the Fed) leaves the room. That said, we expect municipals to remain a bastion of relative stability.

Investor anxiety and today’s market volatility is underpinned by the fear that inflation and higher rates (induced by the Fed) will slow the economy. The Fed’s wind down of bond buying and communications about rate hikes, has mostly impacted the front end of the yield curve.

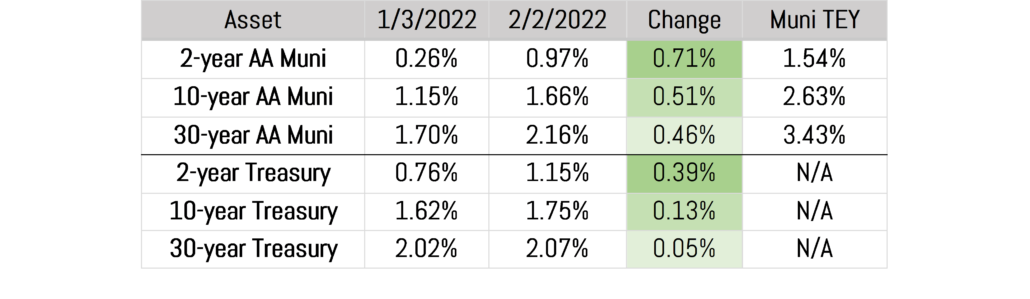
Source: Bloomberg, MMD; TEY calculated at 37% bracket

The market is now pricing in five rate hikes this year alone, projecting the Fed Funds rate will settle somewhere between 1.25% and 1.50%. At the start of the year, the market was pricing in only three rate hikes. One Wall Street analyst is calling for seven hikes, or one at each scheduled Fed meeting through the rest of this year.

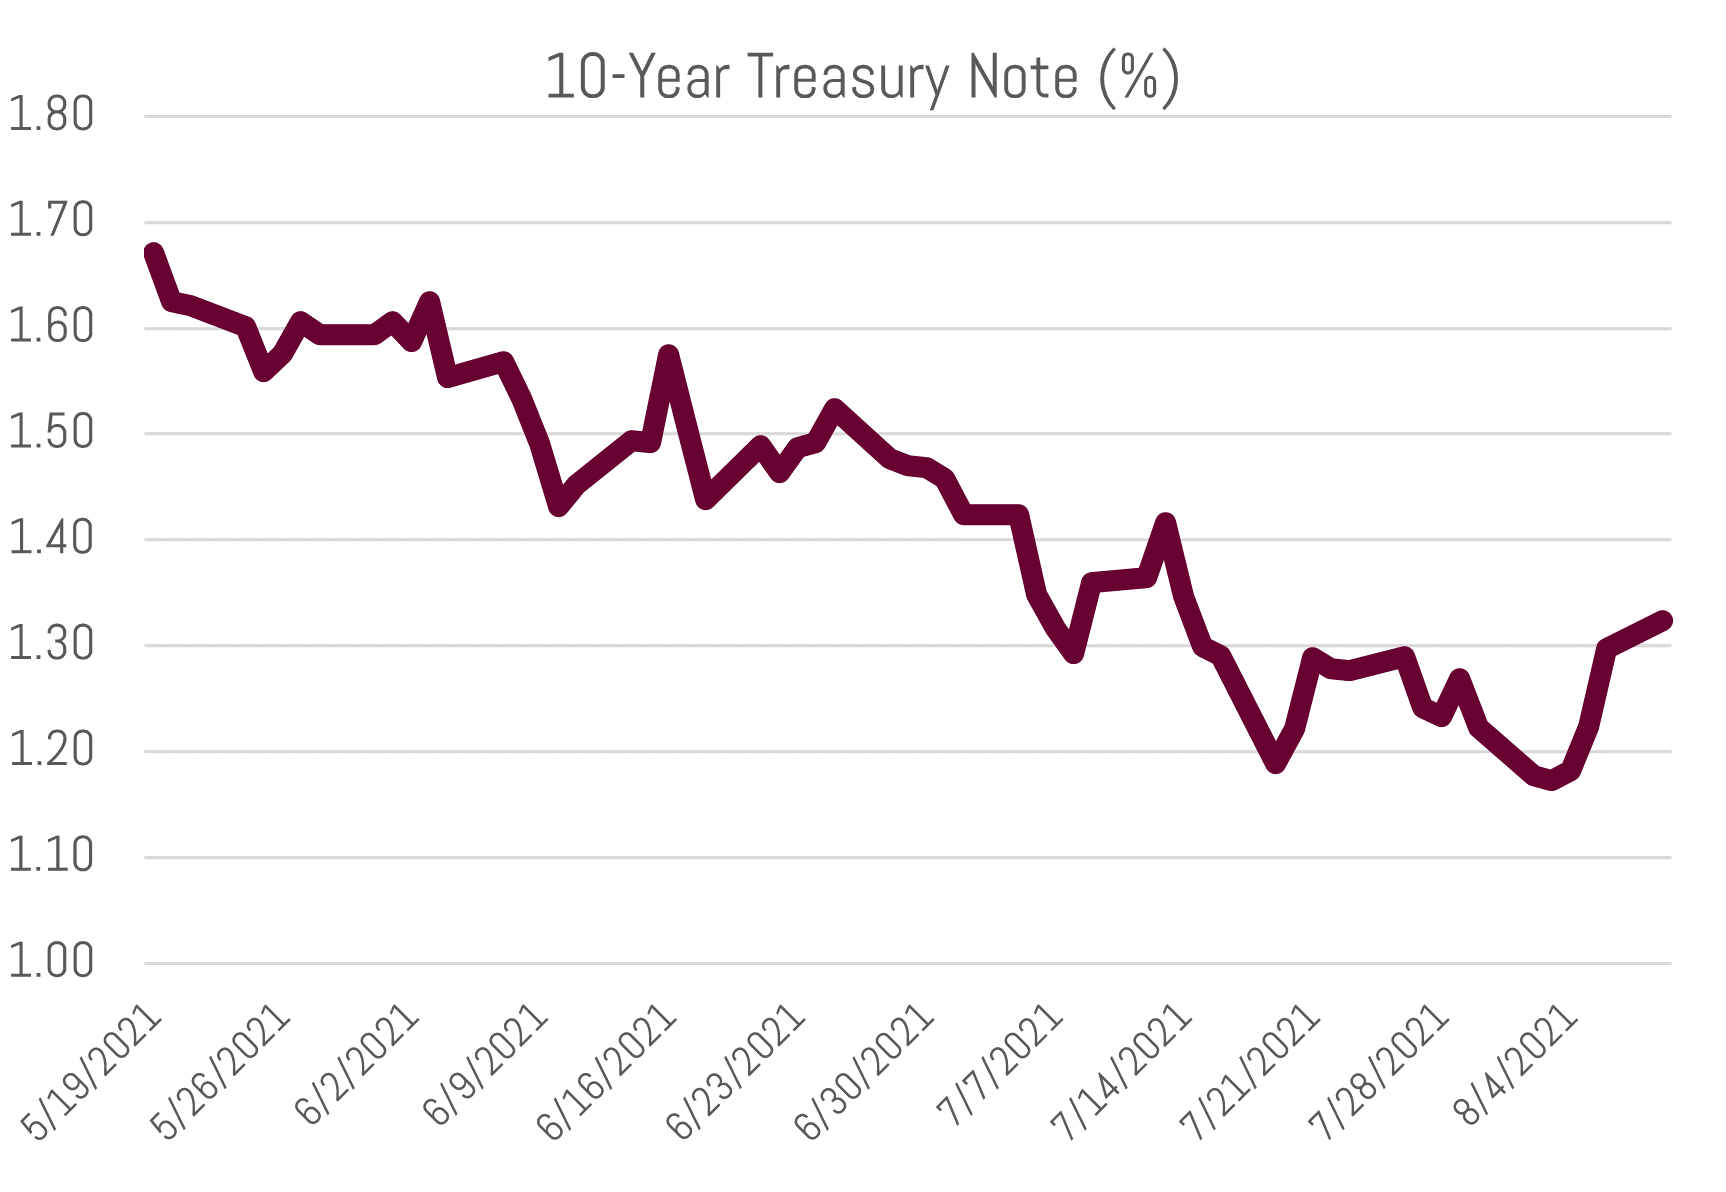
Long term yields have not moved higher at the same pace as short term rates. The reason for this is two parted. For one, short term rates are heavily influenced by Federal Reserve policy and recent Fed communications have indicated higher short term rates in the near future (a la rates hikes noted above). Secondly and alternatively, long term rates are more of a reflection of the market’s view on long term growth and inflation. A 10-year treasury is a projection of where the market believes short term rates will be in 10-years, or roughly 1.77% today. That is not significantly higher than the 2-year treasury, at 1.15%. Essentially the market is expecting an aggressive Fed in the short term (e.g. five rate hikes this year), but a Fed that has limited capacity to raise rates in the long term.

In fact, the difference (“spread”) between the 2-year and 10-year treasury is unusually low relative to past economic cycles. As you can see in the graph below, today’s yield curve never was as steep when compared to the post-recession periods of 2009-2010, 2001-2002, and 1991-1992.4

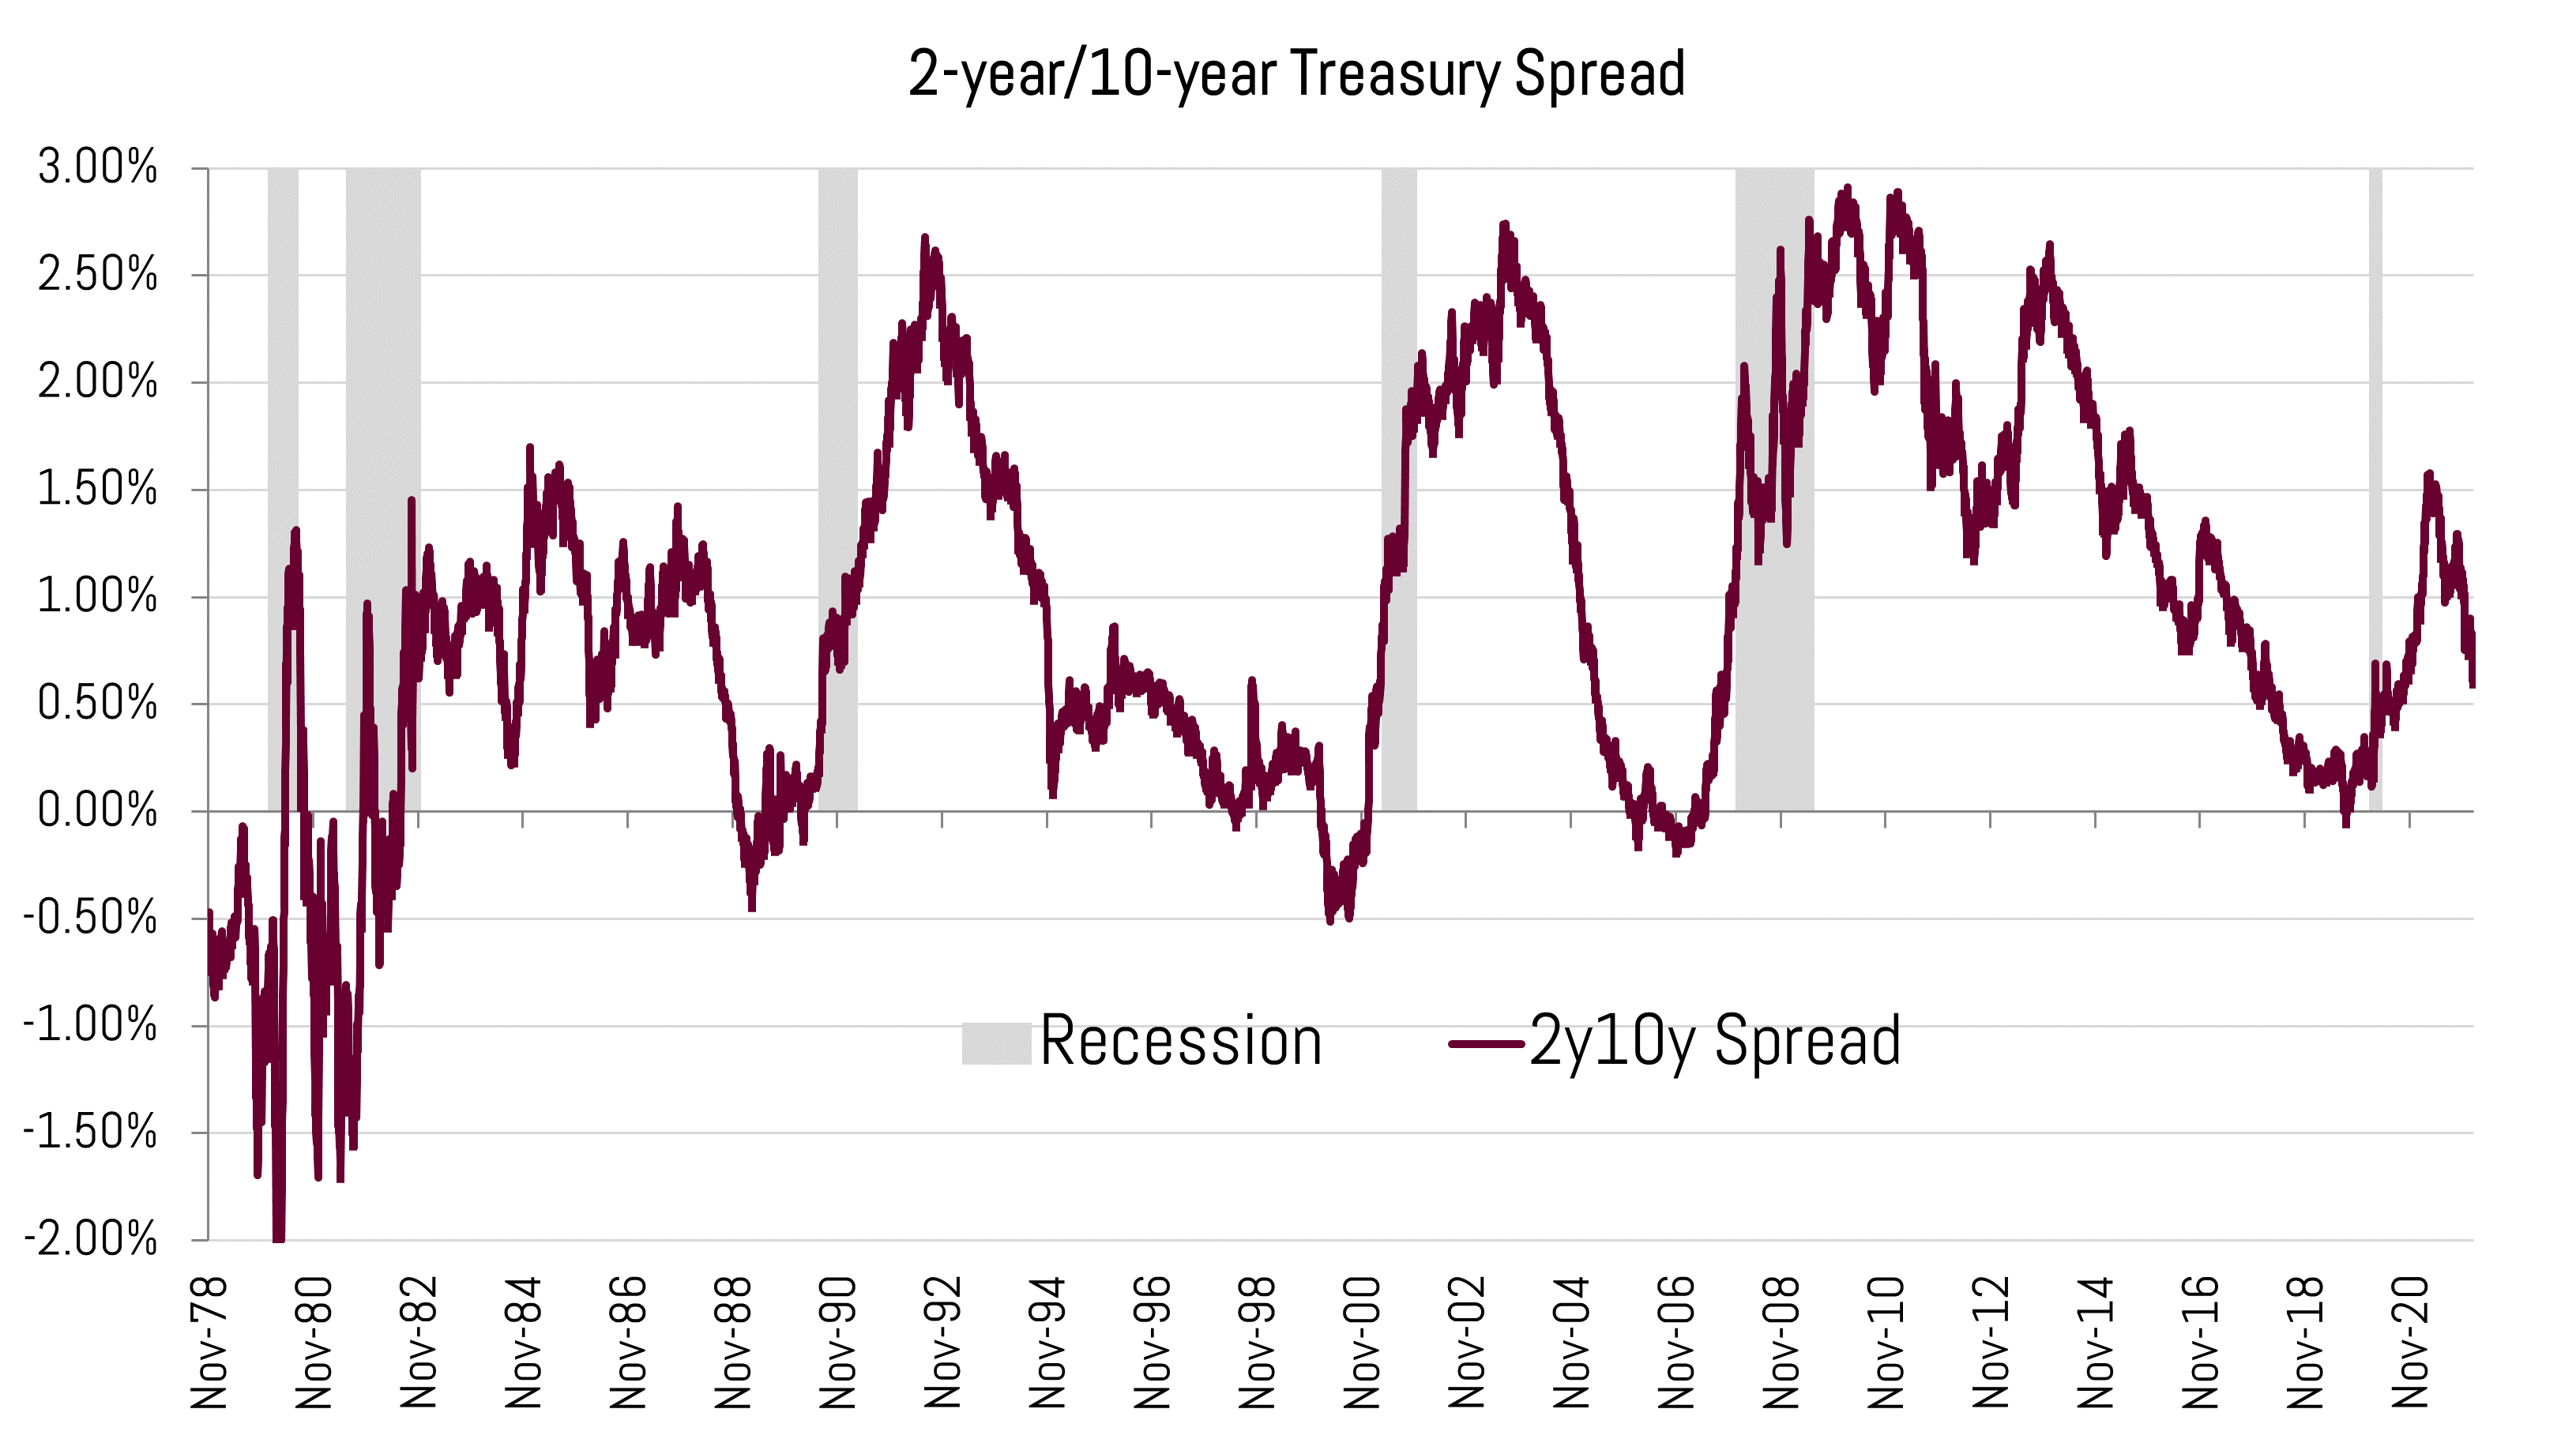
Today’s flat yield curve shape looks eerily similar to the early 1980s during Chairman Volker’s inflation-crushing run as Fed chairman. The 2y/10y spread has averaged 0.93% since the COVID induced recession ended. This compares to a 0.83% average the 2 years following the end of the 1982 recession. Though yields back then were significantly higher (2-year at 10.87% and the 10-year at 11.61%) the yield curve is communicating the same message about projected growth, inflation, and likely yields.

For most of the 1980s the yield curve traded at these flat levels – until Chairman Greenspan started aggressively raising rates in early 1988 to further combat inflation. This flattened the yield curve as the Fed Funds rate was increase from 6.50% in March 1988 to 9.75% in summer 1989. This policy direction ultimately led to a recession in 1990.

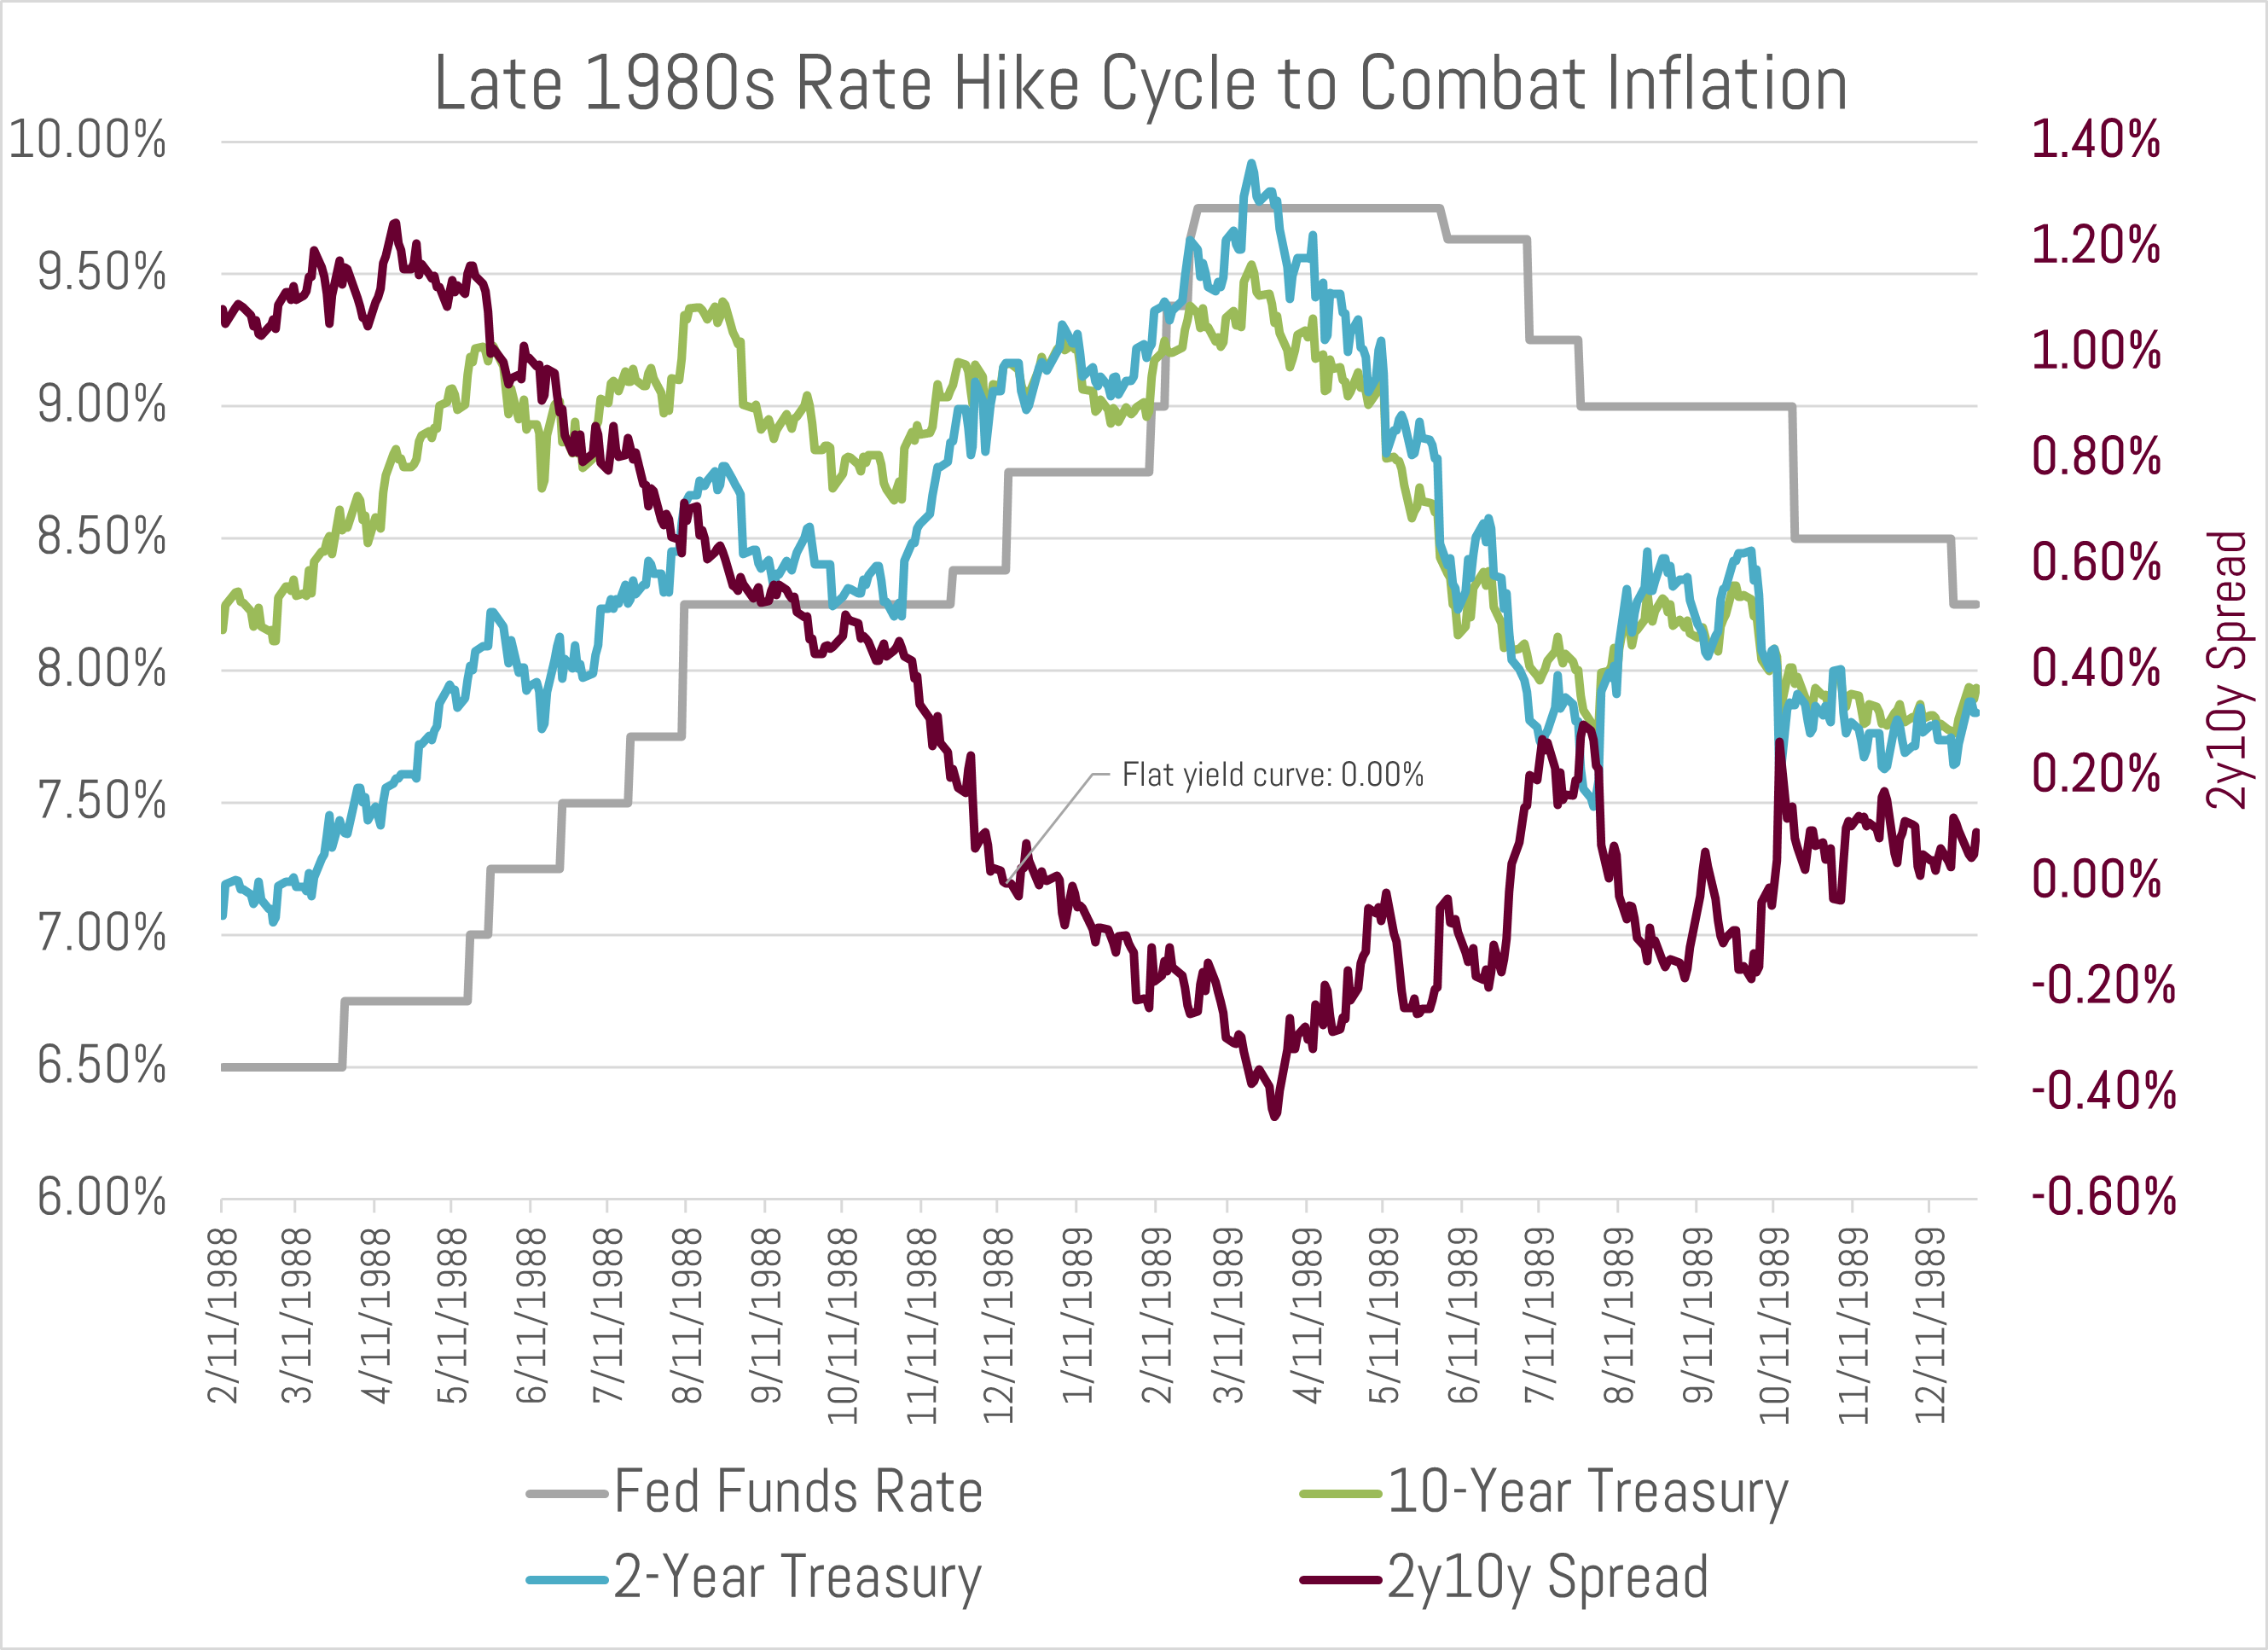
During this hiking cycle the 10-year treasury started at 8.15%, and traded as high as 9.54%. It averaged 8.67% or only 52 basis points higher than its starting point. Today’s 10-year treasury started the hiking cycle5 at 1.45% and currently trades at 1.78%.

Similar to 1988, today’s curve structure leaves little room for Powell to raise rates before the curve inverts. The 2y10y curve inverted in December of 1988, only 9 months after Chairman Greenspan started increasing short term rates. Many market participants fear a flat-to-inverted curve (when short term rates are higher than long term rates). An inverted curve has preceded every recession over the past forty years. Many argue whether it’s a signal or source of the recession. In all likelihood it is a combination and, at the very least, an indicator of poor sentiment within the economy.


Attractive Municipal Yield Ratios (Valuations)

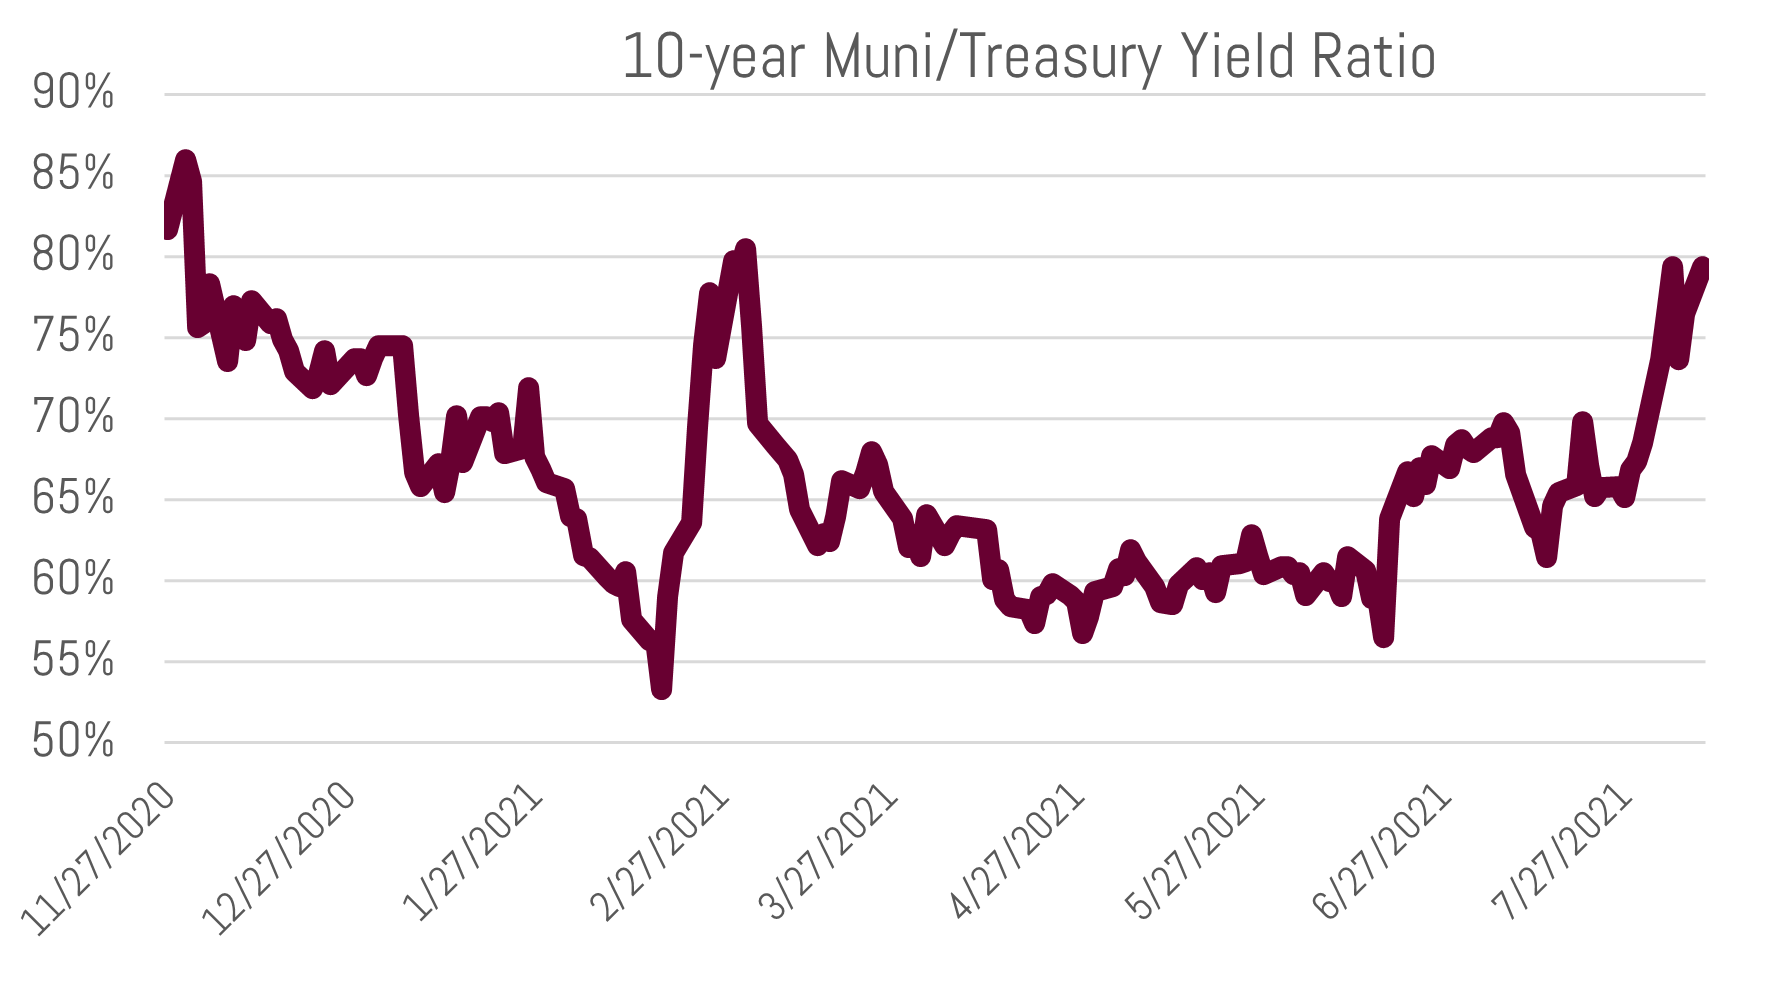
In the current environment we are finding attractive valuations within tax-exempt and taxable municipal bonds. The 10yr ratio (10yr muni/10yr treasury) currently trades at 85%. This is above the pre-COVID level of 75%, and up from a low of 53% in early 2021.  We expect this ratio to trade between 70-80% and believe a move significantly higher is a buy signal for municipals vis-à-vis other high grade fixed income.

A stable level of the ratio is expected given an excellent credit backdrop for your average municipality, ongoing federal stimulus, and high demand for tax-exempt securities from investors. As nominal rates move higher, we expect demand from investors to increase further, supporting present day ratios.

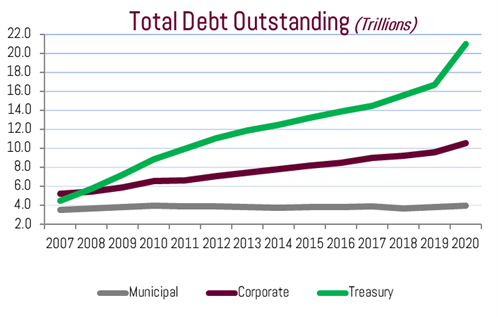
An additional technical factor we see supporting current ratios is a muted supply outlook. If rates move higher, refinancing bond issues will become more difficult. This will reduce new issue supply and support present ratios, possibly even pushing them lower. Supply estimates for the market are in the $425-500 billion range for 2022, following $475 billion last year. We would not be surprised to see a similar-to-lower level than that for 2022.

****

With a balance sheet of nearly $9 trillion – 25% of the overall treasury and mortgage bond market outstanding – the Fed must toe a very fine line through the balance of the year in calming inflation and market volatility alike. If the late 1980s are a guide, the Fed only has limited room to tighten before flattening the curve and inducing a recession.

Please call us to review or discuss your portfolio positioning. Now may be a great time to reconsider the role municipal bonds play in your overall asset allocation, given that yields and ratios for the market have moved higher and trade at relatively attractive levels.


Sincerely,

Matt Bernardi
Vice President
February 2022


[1]TEY is the taxable equivalent yield calculated at the 37% bracket

[2] Cases of COVID-19 were first reported in late-December 2019 in Wuhan, China.

[3] Source: Week ending January 26th;  Lipper US Fund Flows

[4] The COVID induced recession of 2020 – which was the quickest recession on record – officially lasted from February 2020 to April 2020. Source: National Bureau of Economic Research

[5] Mid-December, or when the market started pricing an early 2022 hike

of serving Investors, Issuers, and the Municipal Bond Market 


THANK YOU. We wish you and your family a healthy and prosperous 2022 and offer our profound “thank you” for your continued confidence in the Bernardi team. We greatly appreciate the opportunity to help you, your family, organization, community, and constituents.

September 30, 2021 marked the close of our 37th year.

It was another successful and prosperous year for our clients and, therefore, the entire Bernardi Securities team. A highlight for us was our relocation over Memorial Day weekend into our beautiful, new headquarters located in Northfield, Illinois.


MUNICIPAL BONDS BUILD AMERICA’S INFRASTRUCTURE

The municipal bond market has existed for more than 100 years. It is dynamic, developing, and efficient.

And it fundamentally affects how our economy runs and the quality of life in our communities. For the past thirty-seven years we have focused our expertise and efforts on the municipal bond market. Thousands of communities across the country have allowed us to help them raise low cost capital for infrastructure projects their constituents want, need, and can afford.

For nearly four decades, our investors have provided billions of dollars in capital for infrastructure projects across the nation. Projects such as updating existing school facilities, building new schools, town halls, county courthouses, libraries, airports, and recreation facilities. Investors have helped local, county, and state governments fix their roads, bridges, update water and sewer plants, park district and many other facilities.

For the past thirty-seven years individual investors, community banks, family offices, investment advisers, corporations and many other entities have sought our expertise to help invest their capital in quality, public purpose infrastructure projects across our nation.

Since our inception we have relentlessly focused our efforts to help ensure municipal bonds continue to build America’s infrastructure – playing our part at improving lives along the way.

We are gratified to serve in our role and thankful to all who give us the opportunity. We are merely one cog in the machine, but always strive to do our best for those who rely on us.

I thank our loyal clients – both investors and communities across the country – who rely on our team to help navigate the complicated, nuanced municipal bond market.


COVID CONCERNS CONTINUE

In many respects, March 2020 seems a long way off in the rear view mirror and yet Covid protocols remain in place everywhere around us. Our organization continues to successfully adapt our operating policies and procedures. It has been difficult at times, no doubt. But we continue to learn new ways to successfully operate our business serving our clients – without missing a beat.

The pandemic has taught us much about the facets of society and life, its fragility but also our resiliency in dealing with stress and loss. I tend to gravitate to the first line of Hemingway’s passage from A Farewell to Arms (rather than the balance of the excerpt, which is not published here):

The world breaks everyone and afterward many are strong at the broken places.”

The resiliency of the municipal market has been on full display the past two years, and it has emerged from the crisis a much stronger animal. Largely speaking, most state and local governments quickly reacted and adjusted to the crisis, financially and procedurally so they could continue to govern and provide services in an uncertain and unsafe environment. Traditional revenues that secure bond investors mostly held steady (there were notable exceptions in certain sectors and geographies) and expenses were managed tremendously well, in our view. Federal support was unparalleled helping calm a volatile situation during the initial crisis stage of the pandemic. As important as it initially proved to be, our current analysis points to much of it being largely unnecessary for the average type of credit we invest in. This is a testament to the steady reliability of the municipal bond market as the “mattress money” portion of investment portfolios.  On a very positive note, much of the federal money will now serve as a boon for local economies and municipal credit as a whole.


YES, THE FED IS STILL BUYING BONDS

In the coming years we will learn the level of resilience and reliance of the economy to recent Congressional and Federal Reserve stimulus.

Source: Bloomberg

The Fed has begun the process of tapering – reducing the amount of treasury bond and mortgage backed securities it buys each month – and it has indicated this round of quantitative easing will culminate in March/April of next year. Some predict a rate hike around that time and possibly 1-2 more over the course of the year.

The Fed’s latest projections1 anticipate a long term Fed Funds Rate of 2.50%. This compares to 0.00-0.25% today and a dubious 10-year treasury of 1.48%. With high levels of debt and – potentially – society’s dependency on low rates, is the market doubting the targeted future Fed Funds Rate of 2.50%? Many are wondering just how high yields can march before causing economic harm, overall.

What we do have confidence in transpiring during the coming year are higher levels of equity and fixed income market volatility given the removal of a huge provider of daily liquidity. Bank of America’s MOVE Index – which measures bond market volatility – has been moving higher over the course of this year and is nearing a 5-year (excluding the COVID crisis) high. On December 3rd, the CBOE Volatility Index (VIX), a popular measure of stock market volatility, hit its highest level since January 2020 and the S&P 500 Index moved more than 1% for five straight sessions, the longest streak since November 2020. As the Fed begins to taper, financial market volatility will continue.2

We view volatility as an opportunity for our investors and it is an environment we welcome following years of muted bond market volatility. Our clients’ municipal exposure will act as the ballast of their portfolio should equity volatility persist. We have seen this dynamic play out time and time again over the years. The most recent example during the March 2020 COVID sell off.  Additionally, the laddered portfolio structure, coupled with owning non-benchmark securities, has proven a successful strategy to insulate bond portfolios against market volatility. The latter are relatively immune from mutual fund induced sell-offs and typically offer higher yields at the time of purchase due to their small-to-mid-size issuances.

This strategy and security selection has worked very well for 37-years, and we expect 2022 to play out similarly.

We thank you again for your confidence in our team and wish everyone a happy, healthy, and resilient new year!

Sincerely,


Ronald P. Bernardi

December 30, 2021


[1] Source: https://www.federalreserve.gov/monetarypolicy/files/fomcprojtabl20211215.pdf

[2] Source: Bloomberg

As the Fed publicly discusses it is nearing the end of its emergency approach to the pandemic and begins scaling back its pace of securities purchases, we thought it would be a good time to review the current status of the municipal market and potential outcomes for the 4th quarter.

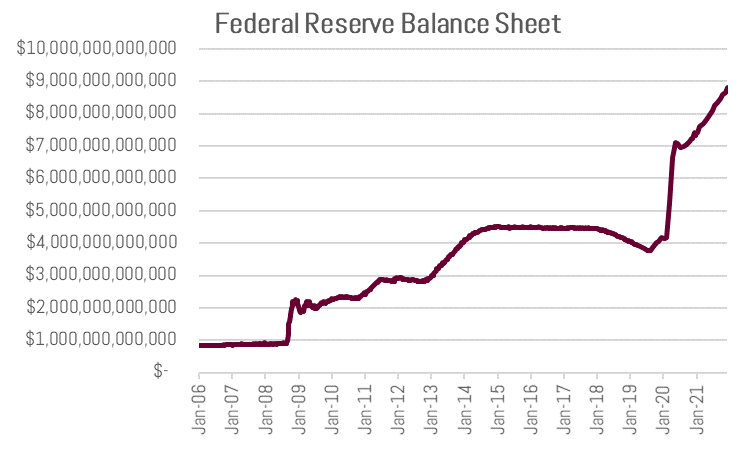
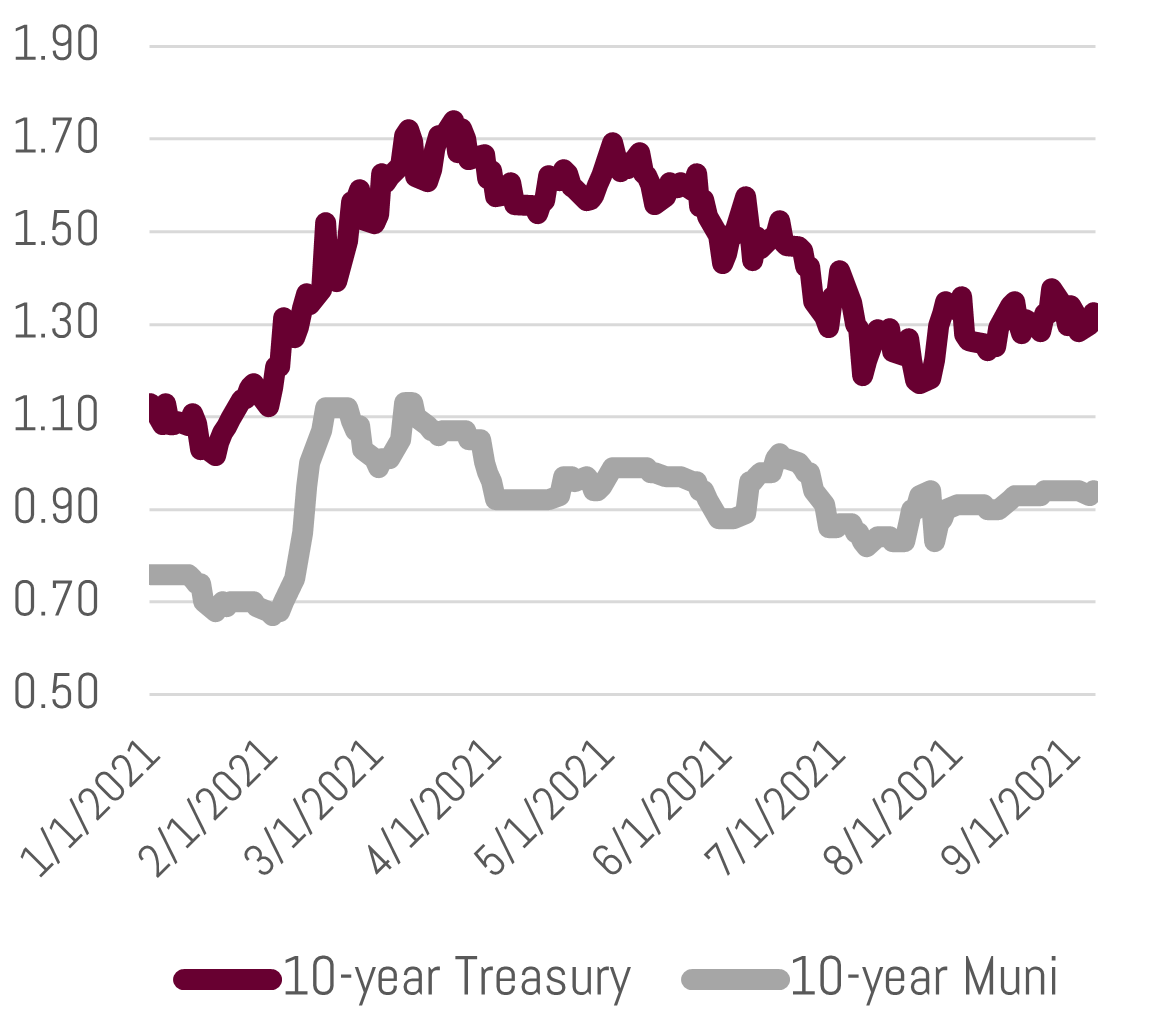
Municipal yields – and bond yields in general – have stagnated since the early spring even though economic growth is robust and inflation readings are high. The market has largely looked through these metrics, as many believe this dynamic will be short-lived. What underpins this stance is the view that growth and inflation metrics are simply boosted by fleeting catalysts such as supply chain bottlenecks and one-time federal stimulus measures. The immense presence of the Fed’s growing balance sheet has served as further support for current market yields, as well.

Municipal yields have trended sideways since mid-summer. The market has experienced robust demand as many investors rebalance out of the equity market following another year of outsized gains. Muted new issue supply, coupled with expectations for higher tax rates, has swelled demand, as well.


Valuation Outlook

At the moment, the ratio of AAA rated 10-year municipal bond yields (0.94%) relative to the taxable 10-year treasury bond yield (1.32%) sits around 71%. This compares to a pre-COVID crisis level average of 83%. So relative to pre-crisis levels, today’s municipal yields are lower vis-à-vis treasuries. Given the current backdrop mentioned above and very strong underlying credit fundamentals for the majority of state and local governments, we expect the ratio to remain in 70-80% range through year-end.

During the previous Fed tightening cycle, municipal valuations tightened. There were certainly bouts of volatility, but over 6 years the 10-year ratio moved lower from 105% in May of 2013 (when the Taper Tantrum began) to 72% in the period right before the COVID-19 outbreak. During this time, the Fed hiked short-term rates from 0.25% to 2.50% and reduced its balance sheet by $700 billion from its height.[1]

Though valuations may be tight from past history, ample spread is still available across the yield curve for smaller-to-medium sized issuers. For income-oriented investors, we believe portfolios should be overweight these types of solid quality issuers within a separate account structure.


Credit Outlook

Credit security (i.e. principal preservation) is a primary reason for investing in municipals and we forecast continued stability in this metric through the end of the year. That said, due to ongoing concerns about COVID-19, tax revenues may continue to be pressured within certain issuers that are dependent on tourism, urban commercial property, and urban transit. Alternatively, suburban and many non-metro credits will continue to benefit from the millennial generation’s march to the suburbs and their demand for larger housing footprints. These locales will also continue to derive benefits from families working in hybrid work-from-home environments.


Duration Outlook

Duration positioning within the fixed income market – and likely most assets classes in general – will be a very important aspect of portfolio construction over the next 6-12 months. We seek to protect portfolios from excessive duration risk through the ladder maturity structure. This strategy diversifies portfolios across the yield curve while maintaining a conservative average maturity. Additionally, it establishes a level of discipline to stay invested and helps us avoid the mistake of attempting to time the next cycle.

Investors should also take heart in the typical relationship of municipal bond yields to treasury yields, in that they tend not to move in lockstep. Our regression analysis showed that for every 100 basis point (1.00%) increase in the 10-year treasury yield, the mean increase in the 10-year municipal yield was 0.82%, which means municipals are less volatile when compared to treasury bonds.

****

As we enter the 4th quarter of 2021, the Fed’s role continues as the main ingredient in market fluctuations. Overall, we remain optimistic on municipal credit with the essential purpose and essential revenue sectors. We expect current valuations to hold in the current ranges of recent months, though the market could experience higher levels of volatility as the Fed begins stepping off the pedal of its easy monetary policies.


Matt Bernardi
Vice President
Bernardi Securities & Bernardi Asset Management


[1] Source: https://www.federalreserve.gov/monetarypolicy/bst_recenttrends.htm

The two main ingredients determining long-term bonds yields are future growth and inflation expectations. Yields have dropped significantly the past number of months as investors have come around to the Fed’s view of high inflation as transitory and the expectation of muted long-term growth projections.

Over the past four months, the 10-year Treasury Note has moved from over 1.70% to under 1.35%. Average yields for 10-year AA rated municipals are 0.99% (taxable equivalent at the 37% bracket is 1.57%). The tax-exempt yield is roughly 75% of treasuries, which is a reasonable valuation relative to historical levels, current market fundamentals, and the potential for higher tax rates.

It is impossible to know if the market’s and Fed’s subdued view on growth and inflation will ultimately be correct. In terms of growth potential, debt (high) and demographics (older and low fertility rates) are major weights on the economy and support the view that long term growth will remain low relative to past experience. This view is corroborated by Japan’s experience and has played out in its domestic financial markets in two ways:

1. Low Yields: Japan’s 10-year treasury is 0.019% (nearly zero)

Click to zoom in on the graphic below. Reference the “Yld” column for Japan under Asia/Pacific. As you will see, negative yields are present in many European countries’ 10-year debt, as well.

Source: Bloomberg


2. Poor stock market returns:
Since the Japanese economy peaked in the 1980s their benchmark stock index (Nikkei) is still well below all-time highs.

Source: Bloomberg

Today’s high levels of fiscal and monetary policy stimulus, and low yields are supportive of high valuations for asset classes across the board, including real estate and the stock market. If you click the link, you’ll notice the Shiller PE Ratio is nearing an all-time high. This ratio was created by Yale economist Robert Shiller and graphs the price to earnings ratio based on average inflation-adjusted earnings from the previous 10 years.

Stocks currently benefit from low yields as:

  • Corporations can fund debt at low levels
  • They enhance relative valuations as: i.) the S&P dividend ratio seems attractive relative to bonds, thereby boosting stock prices and ii.) the P/E multiple of stocks can move higher as P/E ratio of bonds moves higher (price/yield)
  • Discounted cash flow models (a way to value stocks) price the current value of stocks higher when the discount rate (yield) is lower

As the Fed continues to push the pedal to the metal with easy money, this rising tide is lifting all boats (prices).


There are three potential pathways forward in terms of yields:

1. Should we move into a Japan-like scenario, bond prices will continue to benefit (stocks probably not so much). Disinflationary/deflationary economies are good for bond prices (and vice versa).

2. Should the market (and Fed) be wrong, and inflation is here to stay, we believe our laddered portfolios can weather the storm and, over time, take advantage of gradually increasing yields.

The inflationary environment of the late 1970s to mid-80’s took nearly 10-years for the cycle to play out. This is ample time for a laddered portfolio to naturally reorient itself at higher rate levels due to principal/coupon reinvestments.

That said – in all likelihood – the Fed learned its Volker-taught lesson of this time period. Therefore, it would not allow high levels of inflation to persist for such a long time and would quickly stamp this out through monetary tightening policies.

Source: Bloomberg


3. We stay at current levels:

Currently, municipal valuations are relatively attractive to other high-grade fixed income asset classes.

Below is a yield curve comparison depicting yields (from highest to lowest) for:

  • Taxable equivalent yield (37%) of a recent tax-exempt Bangor, WI Electric Utility Revenue issue: This is for example only and demonstrates the types of bonds we invest in for our clients. 
  • AA rated Corporate Benchmark (Bloomberg)
  • Taxable equivalent yield (37%) of the tax-exempt municipal benchmark (MMD)
  • Treasury yields
  • (Dotted) Tax-exempt municipal AA rated benchmark (MMD)

Munis remain attractive in yield and credit quality. A recent Moody’s Default Report[1] noted that:

  • There were no virus-related municipal bond defaults in 2020
  • Municipal ratings were resilient to virus-related pressures…while corporate ratings experienced more frequent rating downgrades
  • Municipal credits continue to remain highly rated

Diversification is key in this environment. Both in terms of asset classes and one’s bond portfolio maturity range. And relatively speaking, municipals remain a very attractive high-grade fixed income asset class when considering both yield and safety.

Relative to other asset classes, bonds will provide a safe-haven in a low inflation/deflationary environment and should not experience the same levels of volatility as stocks during uncertain/bad economic climates. Yields are low given the Fed’s activity in the market, though as I noted above, all asset classes are artificially stimulated given this activity.

If you have any questions regarding your portfolio or the market in general, don’t hesitate to reach out to your Investment Specialist or Portfolio Manager.


Sincerely,

Matt Bernardi
Vice President


[1] Moody’s Investors Service: US municipal bond defaults and recoveries, 1970-2020; July 9th, 2021

The past year and half presented many challenges, but also a multitude of silver-linings and learning experiences. Within the municipal bond market, the experience verified the sector’s overall creditworthy reputation and balance sheet sturdiness. Federal monetary and fiscal policy intervention certainly have helped, though most states projected balanced budgets prior to the latest round of direct fiscal aid.[1] Furthermore, prior to the sharp economic recovery – catalyzed by reopening, Federal aid, and loose monetary policy – most states and localities were dealing with the crisis in stride through job cuts, project delays, draws on cash reserves, debt refinancing, and other fiscal levers. This experience should be comforting to municipal bond investors as the asset class served its primary purpose of principal preservation – largely without extraordinary federal intervention.

Given the nature of the crisis, federal stimulus actions have been unprecedented. The Federal Reserve’s balance sheet now amounts to over $8 trillion, and we are expected to run a federal budget deficit of over $3 trillion for the second year in a row.  This intervention from D.C. has generally impacted the municipal market in two ways:

  • For the healthiest issuers and those best prepared for the crisis, it strengthened their balance sheets and underlying revenue sources to a level where many credits are better situated today than they were before the crisis.
  • It has temporarily bridged the gap for credits that are either i) structurally imbalanced (those that have high fixed costs; e.g. pensions) or those that ii) experienced significant revenue shortfalls as a result of the pandemic (e.g. NYC public transit). For many of these types of issuers, the day of reckoning has simply been delayed and medium-to-long-term credit pressures remain.


Present:

Source: SIFMA

Today’s municipal market is awash in cash, experiencing high levels of demand, and low levels of supply. Sound familiar? Demand is further catalyzed by potential higher tax rates and a very strong credit environment (noted above). In terms of the latter, forty-six states are rated AA- or higher by S&P, while twenty-five are rated AA+ or AAA, which is equal to or better than what S&P rates the US government. If treasury debt continues to mount, an argument could be made for owning municipals vis-à-vis treasuries, as a way to enhance credit.

This technical and fundamental backdrop should lead to a stable market environment for the time being and low muni/treasury ratio levels (low tax-free municipal yields relative to treasury yields). We believe value can be added to portfolios in two major ways:

  • Buying kicker bonds (bonds with a short call date and longer maturity) with 3-4% coupons. Coupons above 4% will likely be called, while coupons lower than 3% are subject to higher durations (i.e. volatility).
  • Smaller-to-medium sized issuers which do not have broad market coverage nor placement within benchmark indexes. Adding these types of issuers are a way diversify away from the average benchmark and enhance yield.

Additionally, for tax-advantaged accounts, taxable municipal bonds offer value relative to other high-grade fixed income and are a way to enhance yield.


Future:

Quiescent market dynamics could give way for two reasons:

  1. Change in Monetary Policy: Later this year the Federal Reserve will likely embark on a path of tighter monetary policy and begin the process of unwinding current levels of extraordinary monetary policy support. The first step will be purely rhetorical – not actually doing anything – through the discussion of tapering balance sheet purchases. Currently the Fed buys $120 billion of treasuries and mortgage back securities each month. Tapering these purchases (likely starting with mortgage bonds) will reduce the size of monthly purchases. The actual balance sheet will continue to grow through 2022.
  2. Infrastructure Bill: The sausage making process is running at full speed in DC today. As part of an infrastructure oriented bill or as separate legislation, Congress may reintroduce Build American Bonds 2.0, similar to the program rolled out during the last crisis. This would directly impact the taxable municipal market, and likely lead to higher supply and higher yields/spreads. Additionally, Congress may allow for municipalities to “advance refund” their debt. This is a refinancing mechanism currently unavailable to issues as a result of the tax reform in 2017. If it is reenabled, this will likely increase tax-exempt municipal supply.

In summary, the municipal bond market remains on solid footing and proved its primary portfolio construction purpose during the travails of 2020. The outlook is favorable as well, though a change in monetary policy may provide opportunities to add exposure and higher yields on resulting market volatility.


[1] The American Recovery Plan was signed into law on March 11, 2021 and allocated $350 billion to state, local, and tribal governments.

Municipal bonds are known for their credit preservation characteristics (and certainly have proved their worth during today’s crisis), but another less known attribute of the asset class is their ability to mitigate duration.1 Duration is one of the primary measures of risk for a bond portfolio and certainly a focal point for today’s portfolio managers. According to our regression analysis, over the past 10 years (as of 12/31/2020), the correlation between tax-exempt municipals and taxable treasuries was high at roughly 88%, but municipals displayed lower volatility. Our regression analysis showed that for every 100 basis point (1.00%) increase in the 10-year treasury yield, the mean increase in the 10-year municipal yield was 0.82%.

Furthermore, municipal yields are less correlated relative to corporates which have displayed a 0.97% correlation over this 10-year period vis-à-vis treasuries. For every 100 basis point increase in the 10-year treasury yield, the 10-year corporate increased 0.94%.

One-year data for the analysis above is not included due to the unusual market dynamics of 2020 when correlations broke down. Municipals displayed a 35% correlation with treasuries last year due to the sharp but brief sell-off experienced in March. The correlation with treasuries soon returned in April and thereafter, as investor worries over credit calmed, and liquidity resumed for money market and mutual fund products. This proved to be, and we acted on, a great buying opportunity for SMA strategies.

Certainly, as the “risk-free-rate” (treasury yields) goes, as will municipals over the long term. But according to the data above the volatility is lower for municipals relative to both treasuries and corporates. Hence, municipals should play a role in investor’s high grade fixed income allocation as both a credit and durational hedge. Given the stable to improving credit backdrop for the market and the potential for higher individual and corporate tax rates, we believe municipal valuations are well supported. Furthermore, should supply remain muted, this provides an additional positive input for the market’s technical environment.

How to defend a bond portfolio in a rising rate environment

Given the above, we believe municipals should play a primary role for high income and high-net-worth investors in the current environment. Within the municipal sector, we believe there are three ways to mitigate a bond portfolio’s sensitivity to rising interest rates:

  1. Target higher – but not too high – coupon bonds: in the current environment we are targeting 3-4% coupon bonds. 5% couponed, “kicker bonds” are attractive as well, though the callability on these is high, so the yield-to-call must offer quite a spread. 3-4% coupon bonds will trade with lower volatility in a rising rate environment relative to a ~2% coupon bond.
  2. Ladder Structure – the ladder does two important things in relation to duration. It i) diversifies portfolios across the yield curve and ii) enables ongoing cash flow for reinvestment. Both qualities prevent over or underinvesting in particular areas of the ever-changing yield curve.
  3. Target non-benchmark issues – Bernardi Asset Management composite portfolios are centered on non-benchmark, smaller to medium-sized issuers. During volatile markets, like we experienced in March, retail fund flows tend to exacerbate performance of the large ETFs and mutual funds, which passively track the benchmark. These funds are forced to sell these benchmark names en masse, further exacerbating their performance and volatility. We believe that a Sharpe Ratio2 analysis demonstrates not only the greater return potential of allocating away from the benchmark, but also a lower portfolio volatility as well:

Source: Morningstar

The results above show that our Tactical Ladder and High Income strategy composites outperform the comparable benchmark from a risk adjusted perspective as defined by the Sharpe Ratio. Additionally, they should be considered in the overall asset allocation conversation as way to differentiate from passive strategies, reduce portfolio volatility, and add value over the long term for investor’s “mattress money” portfolio allocation.


Please contact your Investment Specialist for information about our Municipal Bond SMA strategies.


[1] Duration can be used interchangeably as both the weighted average time until repayment and as the percentage change in price of a bond based on the change in interest rates. The measurements are often nearly the same, but different conceptually. Both provide an indication of how sensitive a portfolio is to a change in market interest rates. The higher the duration, the higher sensitivity a portfolio will have to interest rate changes.

[2] Sharpe Ratio calculation: Return of portfolio minus Risk-free rate divided by the standard deviation of the portfolio.

[3] Standard deviation is a measure of the amount of variation or dispersion of a set of values. A low standard deviation indicates that the values tend to be close to the mean of the set, while a high standard deviation indicates that the values are spread out over a wider range.

Apparent Risk in Municipal Bond Land

In December 2019 we released Unapparent Risk in Municipal Bond Land which recapped a solid year of performance and warned investors of the underlying risks within the municipal market.

We did not expect those risks to come to fruition so quickly, but they certainly became apparent three months later last March. We are gratified in many instances that our positioning of clients’ portfolios provided safeguards against the risks we highlighted, and, in many cases, our portfolio management strategy allowed us to take advantage of market dislocation to the great benefit of portfolios. As we view the market at the end of 2020 we are wondering if it has a similar shape and feel and presents news risks for municipal bond investors due to the impact of the COVID-19 health and economic crisis.

Two of the risks we discussed (i. investment vehicle and ii. “yield hunting”) came to fruition in March when significant dislocation and underperformance occurred in the mutual fund/ETF and lower-grade municipal sectors. We believe significant risk continues to exist in these areas because COVID has exacerbated the conditions of many fiscally mismanaged municipalities and we strongly feel “mattress-money” holdings should avoid these credits. Allocating capital to issuers that are well managed, essential purpose and/or essential revenue bonds – in a separate account portfolio – is the best way to preserve and grow your mattress-money allocation.

2020 has reminded us of many things and certainly these lessons are a silver-lining in a challenging year. Within municipal bond-land we are reminded that, once again, our targeted municipal sectors stand the test of time and hold up during volatile and rough economic climates.

As at the end of 2019, investors are faced with a low-rate environment.  So, while the temptation to take on risk through a higher allocation to sub-par credits, high duration securities (long maturities), leveraged assets, or alternative municipal investment vehicles is understandable – it should be avoided.

A Year in Review

In 2020 the market was certainly tested in both price and credit. In terms of price, at the end of 2019 we asked: “What will the bid market look like…when a large number of funds need to sell similar holdings simultaneously? Will these investment vehicles offer good liquidity and avoid fire sale price selling in this possible scenario?”1


In March, many fund investors received the promised “liquidity” – BUT AT FIRE SALE PRICES. In at least one case, the parent company of a large mutual fund provider was forced to  step in and provide liquidity (use its own capital) to its underlying mutual funds. This event underscores that liquidity is a two-parted measurement. The ability to click a “sell” button and dispose of your shares is a form of “instant” liquidity, but at what price are the shares sold? A fund does not necessarily give you this transparency, nor protect you from selling at an unreasonable price/yield/valuation – unlike a well-managed SMA strategy.

If you or other investors seek liquidity from a mutually owned investment vehicle, that fund must inevitably sell a portion of the underlying holdings. So, on the front end you have a “stock-like” sale that the retail investor experiences, but on the backend the actual value you realize is handled similarly to how any municipal bond is traditionally sold. This disconnect between the investors’ “liquid” sale experience and the ultimate sale of the asset, was exacerbated in March when the front-end retail investor selling outpaced the back-end ability to disburse assets and raise cash from fund providers.

March may have been unique in its scale, but this type of market displacement is not uncommon. We have experienced significant price dislocations every 3-4 years…

Mutual fund/ETF assets have grown significantly, while the number of firms on the bid-side/back-end (broker-dealers and market makers) has shrunk. This factor contributed greatly to the sell-off last March – the most significant of the past twenty years – and is likely it to occur again. There simply was not enough dry powder to take on the waterfall of fund selling.

In mid-to-late March the iShares National Muni Bond ETF2 (chart to the right, ticker: MUB) traded at a significant discount, and then premium, to the value of the underlying holdings. This means, as a seller of the fund in mid-March you were selling the ETF at a discount to where the actual underlying holdings were trading in the municipal marketplace. At one point this discount was 5.76%. Again, liquidity was realized through the instant sale on one’s computer screen…but at what price to the investor?

In times of such market stress, an SMA is not forced into selling and if portfolio liquidity (cash, short maturities) is available, can take advantage of these market dynamics. Additionally, as a liquidity provider, we strive to avoid clients selling bonds at irrational levels, thereby delivering value when liquidity is needed.

March may have been unique in its scale, but this type of market displacement is not uncommon. In recent times the market has experienced significant price dislocations every 3-4 years including 2008-2009 (Great Financial Crisis, GFC), 2010 (Meredith Whitney), 2013 (Taper Tantrum), and 2016 (Presidential Election). We believe the average client portfolio at Bernardi remains on guard and well-positioned to take advantage of similar environments in the future – which we welcome to opportunistically take advantage of for client portfolios.

Source: Bloomberg 

Whereas the selloffs in 2013 and 2016 were not underpinned by credit concerns, March’s sell-off was induced in large part by an underlying concern about the credit health of the average municipality. This was very much like 2008-2009 when investors feared a severe economic contraction would blow insurmountable holes in municipal balance sheets.

To date, the COVID-19 induced economic crisis has played out on a national scale similarly to how a natural disaster impacts a local economy. During such disasters, areas experience an acute economic contradiction, followed by a sharp recovery. Importantly, Moody’s has noted that natural disasters have not been the cause of a single default in the history of the municipal bond market.3 2020 has played out similarly for your average municipal credit.

Though particular sectors (restaurants, hospitality, airports, and nursing homes) continue to face the acute phase of this crisis, the underlying sources of revenue for many municipalities (property, income, sales tax) have not been severely hampered compared to 2019. In many cases, spending has been reallocated between sectors, maintaining overall stability for municipal sales tax revenue. Furthermore, most issuers have various fiscal levers to pull and revenue raising abilities (i.e. raise taxes) when faced with projected revenue shortfalls.  Lastly, our portfolios favor suburban and rural issues, which have benefited through increased demand for housing (high property prices = more property tax revenue) at the expense of city-dwellings.


2021 Outlook: General Stability but Headline Risk Remains

Though 2020 ended calmly for the municipal market, COVID-19 is still with us and its economic scars will linger for some time. The underlying economy has been significantly assisted by both fiscal and monetary policy stimulus, which will likely have less of an impact in 2021. Additionally, the elevated unemployment rate will dampen consumer spending and economic growth.

Given the low-rate environment and early innings of an economic recovery, we believe now is a time to practice patience and not increase risk through buying lower rated issuers/sectors or significantly increase duration. Should the current rate environment continue into the spring and if you are seeking a portfolio strategy offering higher income, we encourage investors and their advisor to look into our High Income Strategy to enhance the underlying yield of their portfolio without sacrificing credit quality.


Apparent Risk in 2021

Risk 1: Sacrificing credit quality for an increase in portfolio yield is one of the main risks we see for 2021. Generally, there are two ways to increase yield by investing in issuers with lower levels of credit health:

  • Invest in bonds that have economically sensitive and/or concentrated underlying sources of revenue.
  • Invest in geographies (states/cities/etc.) faced with structurally imbalanced budgets and poor underlying economic conditions (low growth and/or high taxes). Typically, the biggest overhang for these types of issuers are pension obligations and either an inability or unwillingness to reform and contribute higher levels of funds to close the liability shortfall. If investment returns do not match the projected rates of return, this pension liabilities will put further pressure on such issuers and their fixed costs.

At this time, we do not think either type of these higher risk sectors are suitable for the mattress-money allocation of your net worth, nor is prudent given the current economic climate.

We continue to find value in smaller and medium-sized, ex-metropolitan credits that are too small to be owned by the aforementioned large mutual fund providers. And which are backed by or used for essential services.  


Risk 2:
Certain issuers and sectors remain in desperate condition and are reliant on atypical – and likely temporary – sources of revenue or financing. The recently signed COVID relief and funding bill allocates funds to Chicago Public Schools (CPS) and over $4 billion to New York City’s MTA, while the same agency has already maxed out its allowed financing from the Fed’s Municipal Lending Facility (MLF) and is projected to run significant deficits in the coming years. The State of Illinois has tapped the MLF as well, while the State of New Jersey strongly considered the facility before going to the public markets.

These sources of funding and financing are not a panacea for structurally imbalanced issuers nor comforting for debtholders knowing that one’s security is underpinned by extraordinary Federal intervention.

In the coming years, unless these types of issuers make significant reforms or budget/service cuts, which may be politically unpalatable at the local level, we fear a failure to obtain Federal dollars to bridge their funding gaps can cause not only a cash squeeze to those credits but also “headline risk” in the market generally, thereby unsettling prices.

The types of credits mentioned above are not illustrative of the market as a whole, and any market weakness resulting from their inability to secure extraordinary federal support should be looked at as a buying opportunity for your average credit.

We continue to find value in smaller and medium-sized, ex-metropolitan credits that are too small to be owned by the aforementioned large mutual fund providers. And which are backed by or used for essential services. These types of bonds are a great way to i) add spread (relatively higher yields) and ii) diversify holdings away from large mutual fund providers.

We think patience is warranted in 2021 as the economy heals and rates begin to normalize. Should the recovery move faster than the market or Fed anticipates and if inflations picks up, our traditional ladder strategy will be able to take advantage of the rate reset. That said, we do not think it is appropriate in this environment to reach for yield by targeting low-grade, lower credit issuers.

Please call your Investment Specialist if you have any questions and would like to review portfolio holdings.


Sincerely,

Matt Bernardi
Vice President
January 5th, 2021


  1. Bernardi Securities Unapparent Risk in Municipal Bond Land, December 30th, 2019
  2. Source: Bloomberg “NAV” page
  3. Moody’s US Municipal Bond Defaults and Recoveries, 1970-2019

Taxable municipal bonds (taxable at the federal – and oftentimes state – income level) have historically lacked investors’ attention due to limited supply and presence in a market dominated by investors seeking non-taxable income. Supply has skyrocketed in recent years due to aspects of the 2017 tax reform bill, low nominal interest rates and a flat yield curve. Therefore, taxable municipals are more readily available, and they also offer attractive relative and risk-adjusted returns compared to other high-grade fixed income.


                                       Source: SIFMA U.S. Municipal Bond Issuance                                                                             Source: Bloomberg December 8th, 2020


As demonstrated above by the chart on the right, AAA rated taxable municipals (Bloomberg benchmark index) yield the same or more than the AA rated corporates (Bloomberg benchmark index), even though historical default rates are significantly lower. Equal or higher municipal yields are a result of a lack of direct Fed intervention in the municipal market, illiquidity premium, and general idiosyncrasies of the municipal market (e.g. many more CUSIPs/issuers relative to corporates). We think this dynamic is worth taking advantage of for retirement portfolios (i.e. IRA accounts) and certain investors with a federal income tax bracket below 30%.

2021 is poised to break this year’s record of taxable municipal issuance, but there are threats to future supply. For one, the bulk of the recent issuance is used for refinancing purposes due to the low rate environment. Should rates increase the ability to refinance will become more difficult likely reducing the new issue taxable supply. Additionally, if aspects of the 2017 tax reform are revoked, the supply of taxable municipals may decrease.


High-grade fixed income portfolio construction

Investor portfolios need to take a dynamic approach when considering taxable fixed income options. In most cases, taxable municipal bonds present the most attractive opportunity across the yield curve from a risk-adjusted or outright yield standpoint. However, corporates, U.S. agency securities, certificates of deposit, or treasuries may be more attractive in certain areas of the yield curve depending on market dynamics.

Based on today’s market dynamics taxable municipal bonds are an attractive opportunity for many investors.


Please contact your Investment Specialist for information about our Taxable Municipal Bond SMA strategies.


September 28, 2020

In Part III of our municipal credit commentary pertaining to the health and economic crisis brought on by COVID-19 we overview the most recent data available pertaining to state revenue surveys and data from municipalities within the State of Illinois. Thus far, the data indicates that some of the most dire revenue projections resulting from the pandemic lockdowns have not come to fruition as the resumption of economic activity has been stronger than expected.

That said, the impact of the pandemic has been broadly negative. We remain cautious on the outlook for the sector and as a result are targeting high quality, essential purpose, general obligation or essential revenue issues. We believe there remains downside risk in the most vulnerable sectors and the yield compensation for this additional risk is insufficient.

****

The full extent of revenue shortfalls at the state and local level as a result of the ongoing economic and health crisis will not be known for some time and will surely pressure both revenues and expenditures for years to come. In the early innings of the crisis some projections for the hit to state revenues were dire. The Center on Budget and Policy Priorities, for example, estimated revenue declines of up to 31% compared to pre-COVID projections.[1] The Federal Reserve Bank of Boston noted in July that the tax revenue for certain states could decline greater than 20% to 30%.[2]

However, recent J.P. Morgan analysis significantly contradicts the aforementioned “sky is falling” headline-grabbing projections. They found that that overall YTD tax revenue collections through July have been strong, and most states are only witnessing modest revenue declines of ~4-5%.[3]

Though revenue declines were significant during the depths of the social shut-ins, the recovery in economic activity since reopening has been robust. J.P. Morgan noted that all the states analyzed (19) recorded double digit revenue declines in April, but in July experienced an average 63% increase in income tax collections year-over-year. The State of Ohio in its recent monthly financial report noted August tax receipts were robust and that “Nonauto sales tax, auto sales tax, and personal income tax exceeded estimates by percentages ranging from three percent to ten percent.”[4] Interestingly, it noted the dynamic nature of sales taxes: following the 2Q decline, the economic climate and pandemic realities have caused “shifts in consumption away from services and toward goods.”

Information that we track for Illinois’ local government sales, income and use tax collections distributed to local governments seem to support some of the conclusions arrived at by J.P Morgan and the State of Ohio, as well. Sales tax collection data is available up to and including sales made in June 2020 – declines began in March with 17% lower collections in that month versus the same month in 2019. Declines of 30% and 23% followed in April and May. The data for June provides a less clear comparison given an apparent reporting discrepancy but still indicates that taxes may have increased as much at 13% versus the prior period. For the rolling 12-month period as of June 2020 then, sales taxes were down around 3% with significant variability at the local level (note too that this data isn’t wholly comparable to the state as it includes variations due to local sales taxes enacted by municipalities, not just a state wide tax).

Income taxes were down 50% in April versus April 2019, virtually breakeven in May and June then more than doubled the 2019 period in July before recording a 29% increase in August – on a rolling 12-month basis this amounted to 2-3% increase as of August 2020 (compared to a 6-7% decline if the endpoint was April 2020). Finally and interestingly, use taxes[5] in Illinois appear to have benefitted from internet sales and did not report a year-over-year decline on a monthly basis over the last six months, with the rolling 12-month total up 20% as of June 2020. As the state of Illinois is more reliant on income taxes than sales taxes, these results so far appear generally favorable although likely caused liquidity pressure due to the significant swings in income tax collections. At the local level, distributions of sales taxes (rolling 12-month total of approximately $4.12 billion) far outweigh income tax (approximately $1.38 billion) or use tax (approximately $387 million) distributions.

****

Thus it seems that more volatile sources of operating revenue for many credits issuing general obligation bonds have performed better than anticipated, though impacts still appear to be broadly negative with the possibility of lingering cumulative impact depending on the trajectory of the pandemic.

As of now, many issuers have reacted to the revenue uncertainty by reducing discretionary operating expenses (such as travel, certain fringe benefits, training, etc.) and postponing capital spending where possible. Some have frozen or even reduced headcount. The Bureau of Labor Statistics data indicated state government employment as of August 2020 compared to February 2020 is down 4% while local government employment is down 6% – nearly 1 million jobs in total. Although these percentages are actually below many private sectors of the economy over the same period, it is important to note that the percentage increase in total private employment from July 2008 to February 2020 was 12-13% whereas state and local government increased less than 0.5%, respectively over the same time period.

Source: U.S. Bureau of Labor Statistics 

Although federal aid has certainly benefitted issuers in dealing with direct costs of the pandemic (in particular for sectors such as airports, mass transit and universities), most of the municipal sector has not seen much, if any, direct federal aid to counteract tax revenue losses (though there has been indirect support, such as increased unemployment benefit payments and the Paycheck Protection Program). Proposals for additional federal aid that in part specifically address such government revenue shortfalls have been mired in partisan disagreements about the size and scope of any stimulus plan with attempts at a compromise still ongoing.[6]  

As we noted in our Market Review, the market’s perceived timetable for another round of stimulus was far too optimistic and additional aid to municipalities may not come until after the election. Although state and, in particular, local governments largely avoided assuming the receipt of such federal aid in their budgets, those that did—such as the state of Illinois[7] – are experiencing additional budgetary pressure.

These data points indicate that while revenue sources for many issuers of general obligation and essential service revenue bonds have been negatively impacted, they still performed better than initially anticipated over the last few months of the pandemic. It is important to recognize there is significant variation at the local level and we expect this to continue. Lastly, certain municipal sectors carry significant operational and credit risk even beyond the challenges to most general obligation and essential service bond issuers:

  • Health care; in particular, nursing and retirement care
  • Mass Transit and airport revenue; in particular, credits unsupported by tax revenue or supported by narrow sources of tax revenue (the Metropolitan Transportation Authority in New York City remains on negative outlook. S&P has downgraded several airport credits over the last month while maintaining a negative outlook on most)
  • Narrowly focused, dedicated tax bonds (e.g., hotel/motel taxes, food & beverage or restaurant sales taxes)
  • Higher education; in particular, credits with a more narrow revenue pledge limited to auxiliary revenues (housing & dining services, parking revenues or even student fees). As well as regional state universities and private universities without solid national brand recognition

These types of credits remain more exposed to either elevated costs or sudden declines in revenue (or both) as a result of the pandemic. It remains to be seen, for instance, the ultimate operational impact from the pandemic on universities. Many have invited students to return to campus while many others have discouraged or forbidden students to return for the fall semester. These decisions, of course, have affected systems’ revenues collections and there is no clear solution in sight. Given universities’ ability to shift many classes online, the negative impact is ameliorated somewhat, but this approach may fail in the end if students tire of it. However, even if students remain on campus, with outbreaks remaining a persistent issue, collection of auxiliary revenue and student fees could be negatively impacted – for instance universities in Utah announced fee waivers[8] coming into the 2020-2021 year.

There remains a possibility of a resurgence of COVID-19 in the fall to early winter similar to what many states experienced during late June and July. Additional longer-term pressure could arise depending on the efficacy of a vaccine in terms of not only initial immunity but the durability of immunity from COVID-19[9]. The less effective and durable a vaccine, the larger and more extended the negative impact on these highlighted sectors and indeed, the broader economy and municipal landscape.

Considering this, it appears downside risk remains in the municipal market and in particular, the most vulnerable sectors including health care, transportation, higher education and certain dedicated tax bonds. However, the general obligation and essential service revenue sectors of the market appear to be better positioned to weather this continued pandemic as they have done over the past several months. In particular, we continue to focus on issuers with broad tax or service bases that are better positioned to avoid social unrest and environmental stress (both of which compound the already daunting challenge of the pandemic) as well as areas less reliant on tourism and operating revenue streams less reliant on volatile types of taxes.


Brian Shea
Director of Municipal Credit

Matt Bernardi
Vice President, Investment Specialist


[1] https://www.cbpp.org/research/state-budget-and-tax/states-grappling-with-hit-to-tax-collections

[2] https://www.bostonfed.org/news-and-events/news/2020/07/cpp-covid-state-revenue-impacts-zhao.aspx

[3] JPMorgan Municipal Morning Intelligence, September 2nd, 2020

[4] https://archives.obm.ohio.gov/Files/Budget_and_Planning/Monthly_Financial_Report/2020-09_mfr.pdf

[5] According to the Illinois Department of Revenue, “Sales tax is a combination of ‘occupation’ taxes that are imposed on sellers’ receipts and ‘use’ taxes that are imposed on amounts paid by purchasers.” Refer to https://www2.illinois.gov/rev/research/taxinformation/sales/Pages/rot.aspx, https://www2.illinois.gov/rev/questionsandanswers/Pages/131.aspx, https://www.illinoispolicy.org/illinoisans-will-pay-higher-online-sales-tax-starting-in-2020/

[6] Refer to recent news articles, though this situation remains fluid:

https://about.bgov.com/news/what-to-know-in-washington-house-moderates-plan-stimulus-bill/

https://www.washingtonpost.com/us-policy/2020/09/22/congress-white-house-shutdown-stimulus/

[7] https://www.chicagobusiness.com/government/illinois-may-look-more-junk-pressure-rises-sp-says

[8] https://www.deseret.com/utah/2020/8/18/21374177/utah-public-universities-student-fees-fall-waiving

[9] Refer to https://www.cidrap.umn.edu/covid-19 and https://www.cidrap.umn.edu/covid-19/podcasts-webinars for commentary on the COVID-19 pandemic from a public health perspective

Please find below our portfolio management team’s Summer 2020 Municipal Market Review.

This provides an overview of current market conditions and information about municipal strategies.  If you would like additional information about our outlook, process, or specific strategies, please let us know.

Market Review – Summer 2020